
High resolution flood records in the Yangtze subaqueous delta during the past century and control mechanism
-
摘要:
夏季洪涝灾害对长江流域社会经济造成了严重的影响,急需开展多时空尺度流域洪水发生规律和控制机理的研究,但因洪水器测数据年限短和缺少有效的古洪水沉积记录研究方法而难以实现。选取长江水下三角洲YEC1701柱状样顶部100 cm进行高分辨率XRF岩心连续扫描(XRFCS),粒度、有机碳、N元素、δ13C和210Pb定年分析,并与流域洪水器测或历史记录等进行对比研究,以期建立高效的古洪水沉积记录代用指标。结果表明,长江水下三角洲沉积物中Zr/Rb峰值通常对应粒度粗组分高值和较高的C/N值、偏负的δ13C值,所在层位的沉积年龄与流域洪水事件发生年份有很好的对应关系。由此判断,Zr/Rb值可作为判别长江古洪水沉积的重要代用指标。长江流域于1930—2017年间共发生22次洪水事件,利用XRFCS获得的10 mm和2 mm间隔Zr/Rb值可分别识别出其中的11次和18次,识别率为50%和80%。由此推荐XRFCS样品测试间隔要小于年沉积速率一半以内,以提高古洪水事件的识别率。多源洪水和降雨数据分析表明,长江洪水年际至千年尺度发生规律主要受厄尔尼诺-南方涛动和东亚夏季风、南亚夏季风活动的共同影响。但早期长江洪水资料分辨率较低,长江水下三角洲有较连续的洪水沉积记录,运用XRFCS毫米级分辨率的Zr/Rb值可重建全新世高分辨率的长江古洪水发生历史,更精细地分析气候变化对洪水发生规律的控制机理,为预测全球变化背景下长江洪水演变趋势提供依据。
Abstract:Summer flood hazards have a strong influence on the social economy of the Yangtze River Basin, so it is in dire need of investigating multiple spatiotemporal variations in floods and control mechanisms, but this is handled by short time extent of instrumental flood data and lack of effective research methods for palaeoflood deposition records.A sediment core (YEC1701)collected from the Yangtze subaqueous delta was studied in detail with its top 100 cm through using high-resolution XRF core scanner (XRFCS), and measurements of grain size, organic carbon and nitrogen, stable carbon isotope (δ13C), and210Pb compositions.The above study results were compared with the observing instruments or documental flood data to establish an effective proxy for paleo-flood depositions by comparison with instrumental or documental flood data.The results show that the peak value of Zr/Rb in the subaqueous delta sediments of the Yangtze River usually corresponds to the high value of coarse grain composition, the high value of C/N, and the negative value of δ13C.The sedimentary age of the strata in the delta corresponds well to the year of flood events in the basin.Therefore, the Zr/Rb ratio can be used as an important proxy index for the identification of palaeo-flood sediments in the Yangtze River.Totally, 22 flood events occurred in the period 1930-2017 in the Yangtze River basin, 11 and 18 of which were identified by the XRFCS Zr/Rb data in terms of 10 mm and 2 mm measurement intervals with effective recognition rates of 50% and 80% respectively.It is therefore recommended to perform XRFCS measurement with a smaller interval than half of sedimentation rates for better recognition rates of flood events.Multiple source data of river floods and precipitations were analyzed to show that river floods in Yangtze River basin are majorly influenced by ENSO (El Niño-Southern Oscillation), EASM (East Asian summer monsoon) and SASM (South Asian summer monsoon) over different time scales from multiple years to millennium.However, the time resolution for earlier flood records is very low, and it can be greatly improved by employing XRFCS mm-scaled Zr/Rb ratio of continuous flood depositions in the Yangtze subaqueous delta.This will also improve our understanding of controlling mechanisms of flood events and then better prediction of flood variation in response to global climate change.
-
Keywords:
- Yangtze /
- flood deposition /
- Zr/Rb ratio /
- ENSO /
- East Asian summer monsoon /
- South Asian summer monsoon
-
煤中稀土元素的研究一直是煤地球化学领域研究的热点问题,一方面是因为煤中稀土元素具有均一化程度高、化学性质稳定、不易受变质作用影响等特殊的地球化学特征,其赋存状态、分配模式可以指示成煤环境、追踪对比煤层[1-5];另一方面是稀土元素含量较高的煤层,煤灰中富集的稀土元素达到了工业利用价值[6],提高了煤炭综合清洁利用水平,如俄罗斯远东和中国西南晚二叠世煤中稀土元素富集,煤灰中稀土元素含量可以达到工业利用标准[7]。
20世纪90年代开始,中国学者开始对煤中稀土元素的含量及地球化学特征进行研究[8-11]。对不同成煤时代及不同成煤环境煤中稀土元素的分布模式、成因、赋存状态等进行了详细研究,研究区域涉及华北、淮南、淮北、西南等各大煤田[12-14]。相对于其他国家和地区煤中稀土元素的含量,中国煤中稀土元素的含量变化范围更大,含量更高。根据煤中稀土元素含量的差异,可以重塑成煤环境演化史;根据稀土元素标准化曲线能判断母岩的类型、来源等重要信息;重稀土和轻稀土元素的分馏机制与煤的形成环境紧密关联,可以分析煤炭沉积史。聚乎更矿区是青海省木里煤田重要的大型煤矿区之一,煤炭资源储量丰富。目前主要针对聚乎更矿区的地层构造、煤岩煤质及沉积环境开展了诸多研究并取得了一些成果[15-17];然而关于成煤环境研究较少,煤中微量元素的研究基本未开展。本文对聚乎更矿区煤中稀土元素的地球化学特征进行初步分析,从煤地球化学角度探讨煤层沉积环境和物源特征,为煤炭资源清洁利用提供基础理论依据。
1. 地质背景
木里煤田位于中祁连坳陷带的中西部,总体走向为北西西—南东东向,经过多期构造演化形成中生代含煤盆地的构造形态[15]。聚乎更矿区位于青海省木里煤田中西段(图 1),构造线总体方向为北西向,整体构造形态为一复式向斜,向斜轴倾向北东∠50°~70°。矿区共划分为4个井田和3个露天矿。矿区含煤地层为中侏罗统木里组和江仓组,大部分地区中侏罗统不整合于三叠系之上,仅局部地区与下侏罗统整合接触。木里组下段为辫状河冲积平原环境,沉积了一套粗碎屑岩;上段以三角洲前缘-泻湖沼泽环境为主,发育主要可采煤层下1煤和下2煤(图 2)。下1煤全区可采,主要形成于三角洲前缘沉积环境,夹矸发育,岩性以泥岩、粉砂岩为主,受河流作用影响较大[18]。下1煤层厚度范围为0.68~39.95 m,平均厚度为11.55 m。下1煤形成时期沉积环境比较稳定,受后期构造变化的影响,煤层厚度由西向东逐渐变薄。江仓组下段主要为三角洲-湖泊沉积环境,含煤2~6层;上段以浅湖-半深湖环境为主,沉积了一套细碎屑泥岩、粉砂岩,不含煤。本次研究对象为木里组下1煤层。
![]() 图 1 研究区区域地质及采样位置图Figure 1. Regional geology and sampling location map of the study area
图 1 研究区区域地质及采样位置图Figure 1. Regional geology and sampling location map of the study area![]() 图 2 聚乎更矿区煤层沉积柱状图Figure 2. The sedimentary histogram of coal seam in the Juhugeng coal district
图 2 聚乎更矿区煤层沉积柱状图Figure 2. The sedimentary histogram of coal seam in the Juhugeng coal district2. 样品采集与测试
本次在聚乎更矿区一井田、三井田和四井田主采煤层下1煤共采集样品20件(图 1),其中煤样品14件,顶底板样品6件。采样时首先在剖面上按宏观煤岩类型自然分层,用记号笔标注分层位置和样品编号,自下而上逐层刻槽采样,每个样品重量约2 kg,样品采集后迅速装入已编号的采样袋中,以避免水分散失和污染。为更好地对比煤中稀土元素来源的影响,采集了顶底板泥岩样品。其中,一井田采集煤样12件,顶底板泥岩样品各1件;三井田采集煤炭组合样1件,顶底板样品各1件;四井田采集煤炭组合样1件,顶底板样品各1件。
样品采集后及时送至江苏地质矿产研究分析测试中心,依据煤的工业分析方法(GB/T212—2008)测试了聚乎更矿区下1煤的煤质数据;利用光学显微镜(DM2500P)获得了煤岩显微组分图像;采用X射线荧光光谱法(XRF)进行了样品主量元素K2O、Na2O、SiO2、Al2O3、Fe2O3、CaO、MgO、SO3、MnO2、P2O5和TiO2的定量分析;采用高分辨电感耦合等离子质谱(ICP-MS)进行了样品稀土元素质量分数的测试;利用全岩和粘土矿物X射线衍射(XRD)对煤层顶底板泥岩样品进行了矿物组分测试。
3. 结果和讨论
3.1 煤及顶底板泥岩中稀土元素含量
因Y的地球化学性质和稀土元素非常相似,而且其离子半径、离子电荷与Ho极相似,本文将Y置于Dy和Ho之间,与稀土元素一起讨论[6]。单从稀土元素总量看,其数值变化较大,聚乎更矿区下1煤中稀土元素(REE)含量为5.23×10⁻⁶~55.79×10⁻⁶,平均值23.01×10⁻⁶,该数值明显低于中国煤中的REE质量分数平均值(135.89×10⁻⁶)[19]和世界煤中的平均值(68.47×10⁻⁶)[20],表明聚乎更矿区下1煤中稀土元素含量总体不高,相对不富集(表 1)。下1煤层顶底板泥岩中稀土元素含量为99.96×10⁻⁶~265.68×10⁻⁶,平均值为198.62×10⁻⁶,可见泥岩中稀土元素总量远高于煤中,平均值为煤中的8.6倍,且相对富集轻稀土元素(LREE)(表 2;图 3)。Seredin等[6]研究发现,同一物源条件下,稀土元素在煤层顶底板细粒岩石中更易于富集。本次稀土元素测试结果与Dai等[21]在该区的研究结果一致,受陆源碎屑的输入影响,稀土元素在泥岩中更容易富集。
表 1 聚乎更矿区下1煤中稀土元素含量Table 1. The content of rare earth elements in the No.1 coal from Juhugeng coal district10-6 采样位置 样品编号 岩性 La Ce Pr Nd Sm Eu Gd Tb Dy Ho Er Tm Yb Lu Y 一井田 1J-1 顶板泥岩 43.5 81.7 8.72 33.3 6.42 1.28 5.51 0.88 4.83 1.00 2.77 0.46 3.03 0.48 27.1 1J-2 原煤 2.17 2.99 0.51 1.66 0.24 0.025 0.25 0.042 0.17 0.040 0.12 0.042 0.12 0.027 2.21 1J-3 原煤 1.46 3.20 0.54 1.72 0.28 0.070 0.26 0.055 0.30 0.070 0.21 0.043 0.26 0.046 2.04 1J-4 原煤 2.70 4.51 0.60 1.77 0.26 0.10 0.28 0.054 0.30 0.061 0.18 0.035 0.19 0.035 1.50 1J-5 原煤 1.77 2.13 0.59 1.61 0.23 0.16 0.23 0.052 0.20 0.045 0.13 0.033 0.14 0.036 1.41 1J-6 原煤 2.32 4.06 0.58 1.84 0.30 0.053 0.28 0.054 0.27 0.057 0.17 0.035 0.18 0.034 1.58 1J-7 原煤 2.08 3.46 0.56 1.80 0.29 0.086 0.27 0.049 0.22 0.080 0.14 0.032 0.16 0.033 1.24 1J-8 原煤 1.62 2.89 0.51 1.61 0.26 0.069 0.24 0.047 0.23 0.053 0.15 0.034 0.17 0.035 1.47 1J-9 原煤 4.00 6.89 0.85 3.04 0.53 0.12 0.48 0.089 0.53 0.12 0.36 0.066 0.45 0.076 3.49 1J-10 原煤 14.1 19.7 2.16 6.24 0.91 0.21 1.02 0.19 0.92 0.19 0.56 0.11 0.61 0.11 5.39 1J-11 原煤 8.66 15.8 1.82 6.73 1.33 0.25 1.19 0.19 1.13 0.23 0.65 0.10 0.69 0.14 6.46 1J-12 原煤 12.2 18.9 1.87 6.83 1.33 0.36 1.24 0.22 1.46 0.33 1.00 0.21 1.20 0.18 8.50 1J-13 原煤 7.68 14.0 1.52 6.07 1.25 0.24 1.10 0.18 1.04 0.20 0.54 0.08 0.51 0.08 5.72 1J-14 底板泥岩 34.2 68.3 7.26 26.4 4.55 0.76 3.99 0.61 3.13 0.59 1.61 0.28 1.69 0.29 16.1 三井田 3J-1 顶板泥岩 51.2 97.2 11.4 41.1 8.04 1.61 6.70 1.04 5.84 1.20 3.42 0.54 3.69 0.56 32.1 3J-2 原煤 0.69 1.10 0.43 0.95 0.17 0.019 0.17 0.04 0.17 0.04 0.12 0.03 0.17 0.03 1.11 3J-3 底板泥岩 51.7 96.1 10.9 38.5 7.80 1.50 6.59 1.05 6.12 1.24 3.46 0.55 3.74 0.56 35.3 四井田 4J-1 顶板泥岩 33.2 63.9 7.18 27.1 5.04 1.09 4.30 0.66 3.44 0.68 1.94 0.32 1.92 0.33 19.1 4J-2 原煤 2.48 2.67 2.09 2.85 0.27 0.012 0.41 0.10 0.04 0.02 0.07 0.09 0.15 0.07 1.38 4J-3 底板泥岩 17.9 31.3 4.35 15.4 2.91 0.84 2.74 0.53 3.17 0.63 1.66 0.29 1.63 0.29 16.4 表 2 聚乎更矿区下1煤中稀土元素地球化学参数Table 2. Geochemical parameters of rare earth elements in the No.1 coal from Juhugeng coal district采样位置 样品编号 Ad/% REE LREE HREE L/H (La/Yb)N (La/Sm)N (La/Lu)N (Gd/Lu)N δEu δCe 一井田 1J-1 / 220.9 174.9 46.05 3.8 9.67 4.26 9.42 1.43 0.66 1.01 1J-2 1.20 10.61 7.59 3.02 2.51 12.69 5.675 8.45 1.147 0.31 0.688 1J-3 6.71 10.56 7.27 3.29 2.21 3.78 3.306 3.31 0.704 0.80 0.866 1J-4 4.71 12.57 9.93 2.63 3.77 9.63 6.51 7.92 0.995 1.17 0.855 1J-5 25.41 8.78 6.50 2.28 2.85 8.44 4.76 5.12 0.801 2.09 0.500 1J-6 3.09 11.81 9.15 2.65 3.45 8.50 4.934 7.06 1.003 0.57 0.839 1J-7 2.33 10.50 8.28 2.22 3.72 8.52 4.555 6.63 1.009 0.96 0.550 1J-8 3.31 9.39 6.96 2.43 2.86 6.26 3.950 4.82 0.842 0.86 0.766 1J-9 6.52 21.10 15.43 5.67 2.72 6.00 4.73 5.50 0.797 0.75 0.90 1J-10 35.14 52.4 43.3 9.10 4.76 15.53 9.70 12.93 1.12 0.67 0.86 1J-11 9.70 45.35 34.6 10.77 3.21 8.44 4.10 6.65 1.09 0.62 0.96 1J-12 18.53 55.8 41.4 14.36 2.89 6.81 5.73 6.99 0.86 0.85 0.95 1J-13 5.77 40.23 30.8 9.45 3.26 10.25 3.87 10.19 1.74 0.63 0.99 1J-14 / 169.8 141.5 28.29 5.0 13.63 4.73 12.45 1.74 0.54 1.04 三井田 3J-1 / 265.7 210.6 55.1 3.8 9.36 4.00 9.46 1.48 0.67 0.97 3J-2 17.82 5.23 3.35 1.88 1.78 2.80 2.559 2.28 0.68 0.34 0.48 3J-3 / 265.1 206.5 58.6 3.5 9.33 4.17 9.53 1.45 0.64 0.97 四井田 4J-1 / 170.3 137.6 32.71 4.2 11.70 4.15 10.56 1.63 0.71 1.00 4J-2 4.45 12.70 10.37 2.33 4.46 10.99 5.771 3.84 0.76 0.11 0.28 4J-3 / 100.0 72.7 27.30 2.7 7.42 3.87 6.43 1.18 0.91 0.85 注:陨石数据采用Boynton推荐的球粒陨石平均值[25];∑LREE=La+Ce+Pr+Nd+Sm+Eu;∑HREE=Gd+Tb+Dy+Ho+Er+Tm+Yb+Lu;∑REE=∑LREE+∑HREE;(La/Yb)N、(La/Sm)N、(La/Lu)N、(Gd/Lu)N元素球粒陨石标准化值的比值;δEu=EuN/(SmN×GdN)1/2,δCe=CeN/(LaN×PrN)1/2,EuN、SmN、GdN、CeN、LaN、PrN为元素球粒陨石标准化值 ![]() 图 3 下1煤中轻、重稀土元素含量分布Figure 3. Distribution of light and heavy rare earth elements in the No.1 coal
图 3 下1煤中轻、重稀土元素含量分布Figure 3. Distribution of light and heavy rare earth elements in the No.1 coal由于成煤微环境的差异性或后期热液淋滤富集作用的影响,即使是在同一煤层不同分层样品中REE的含量波动也较大。例如一井田下1煤中稀土元素含量范围为8.78×10⁻⁶~55.79×10⁻⁶,最大值和最小值相差6.4倍,说明稀土元素在同一煤层中的分布并不均匀,推测主要与沉积环境有关,粘土矿物含量较高的煤中,粘土矿物吸附大量的稀土元素,造成稀土元素含量差异明显(表 2)。
3.2 稀土元素地球化学特征
稀土元素的地球化学参数可以较好地反映稀土元素特征,不同的参数可以表征不同稀土元素的富集和成因,对煤炭聚集和成煤环境有较好的指示意义[22-23]。稀土元素在沉积作用过程中可能发生分离,主要受稀土元素的水合、吸附特征和络合物的溶解性影响[24]。轻稀土元素易于被粘土矿物吸附并富集,重稀土元素易于与碳酸盐或有机质形成络合物;通常陆相沉积物中轻稀土元素富集,海相沉积物中重稀土元素富集[13-14]。根据聚乎更矿区稀土元素测试数据,计算出聚乎更矿区煤中及顶底板泥岩中稀土元素有关地球化学参数(表 2)。从表 2可以看出,煤系轻稀土元素(LREE)含量在3.35×10⁻⁶~210.61×10⁻⁶之间,平均值为58.93×10⁻⁶;重稀土元素(HREE)范围为1.88×10⁻⁶~58.60×10⁻⁶,平均值为16.00×10⁻⁶。LREE/HREE值为1.78~5.00,平均值为3.38,说明轻稀土元素较重稀土元素富集,特别是顶底板泥岩中,轻稀土元素明显富集。(La/Yb)N值为2.80~15.53,平均值为8.99,说明轻、重稀土元素分异明显(图 3);(La/Sm)N值为2.56~9.70,平均值为4.89,表明轻稀土元素富集,且在不同层位的富集程度变化明显;(La/Lu)N的平均值为7.48,以轻稀土元素富集型为主,稀土元素分馏较明显;(Gd/Lu)N值为0.68~1.74,平均值为1.12,表明重稀土元素不富集;δEu的范围为0.11~2.09,平均值为0.77,呈现负Eu异常;δCe范围为0.28~1.04,平均值为0.80,呈现微弱的负Ce异常。
3.3 稀土元素分配模式
稀土元素分布模式图可以直观地反映稀土元素的地球化学特征。一般是将稀土元素数值参照某一标准值标准化后再做其分布模式图,常用球粒陨石、北美页岩或上地壳稀土元素平均值对稀土元素进行标准化[26-27]。为了更直观地反映聚乎更矿区下1煤中稀土元素的分布,本文利用Boynton[25]推荐的球粒陨石平均值对稀土元素进行了标准化,绘制了聚乎更矿区下1煤中及顶底板泥岩中REE的球粒陨石标准化图谱(图 4)。稀土元素分布模式图分析如下。
![]() 图 4 聚乎更矿区一、三、四井田下1煤中稀土元素分配模式图Figure 4. Distribution patterns of REE in the No.1 coal of the first, third and fourth field from the Juhugeng coal district
图 4 聚乎更矿区一、三、四井田下1煤中稀土元素分配模式图Figure 4. Distribution patterns of REE in the No.1 coal of the first, third and fourth field from the Juhugeng coal district(1) 聚乎更矿区一井田、三井田、四井田煤中的稀土元素分配模式相似,总体呈现为左高右低的宽缓的“V”型曲线,说明成煤期间物源一致,陆源物质的供应相对稳定。随着元素从La到Lu,稀土元素的标准化值逐渐降低,且大部分在Eu处存在明显负异常。Eu的异常一般认为由母岩继承而来,顶底板泥岩中呈现明显的“V”型,煤中不明显,表明泥炭堆积过程中,陆源碎屑输入较少,煤中灰分含量低也给予了佐证;泥岩对母岩的继承性强,受后期成岩作用影响较小。La-Sm段曲线较陡,斜率较大,Gd-Lu段曲线较缓,斜率较小,在Eu处呈小谷。
(2) 在一井田下1煤中,由于煤分层中稀土元素含量存在一定差异,在分配模式图中表现为分配曲线不完全重合,而是有一定间隔的排列,体现出即使是同一煤层成煤过程中微环境也有较大变化。在四井田下1煤中,4J-2样品的稀土元素分布模式Pr值出现异常峰值(图 4),同样说明沉积微环境对稀土元素含量有一定程度的影响。
(3) 聚乎更矿区煤层顶底板的稀土元素分布模式与煤层的稀土元素分布模式十分相似,只是含量高于煤中稀土元素的含量,约是煤层中稀土元素含量的8.6倍,表明成煤时期,泥炭沼泽陆源物质供给较弱,成煤前和成煤后陆源供给稳定,煤层和顶底板岩石中稀土元素来源一致,只是含量不同。Zhao等[28]指出另一方面原因是,当煤层顶板沉积时,聚煤过程终止,丰富的陆源碎屑为顶板提供了大量的稀土元素,同时孔隙溶液不断地渗入到靠近顶板的煤层,造成顶板附近的煤层中稀土元素含量较高(表 1;图 4)。
(4) 三井田、四井田煤层中稀土元素含量很低,仅为5.23×10⁻⁶和12.70×10⁻⁶,而煤层顶底板中稀土元素含量相对较高,分别为170.27×10⁻⁶和265.68×10⁻⁶,几乎为煤层中稀土元素含量的20倍,表明三井田和四井田下1煤层成煤环境稳定,受河流作用影响较小,煤炭沉积时物源供给少。
3.4 煤层顶底板泥岩中稀土元素的富集特征
根据XRD对下1煤层顶底板泥岩矿物组分的测试结果(表 3),主要以石英和粘土矿物(TCCM)为主,还含有少量的钾长石、斜长石和菱铁矿。石英含量范围为41%~63%,平均值为48.2%;粘土矿物含量为31%~58%,平均值为47.7%。粘土矿物以高岭石和伊利石为主,含有很少量的蒙脱石和绿泥石。高岭石含量为15%~25%,平均值为21%;伊利石含量为14%~34%,平均值为25.5%。
表 3 下1煤层顶底板泥岩矿物组分与含量Table 3. The mineral composition and content of mudstone in roof and floor of the No.1 coal样品编号 矿物含量/% 黏土矿物/% 稀土元素含量/10-6 石英 钾长石 斜长石 菱铁矿 TCCM 高岭石 伊利石 蒙脱石 REE LREE HREE 1J-01 47.0 1.0 52.0 25 27 220.9 174.9 46.05 1J-14 46.0 54.0 24 28 2 169.8 141.5 28.29 3J-01 41.0 5.0 4.0 50.0 24 26 265.7 210.6 55.1 3J-03 42.0 58.0 24 34 1 265.1 206.5 58.6 4J-01 50.0 3.0 4.0 2.0 41.0 15 24 1 170.3 137.6 32.71 4J-03 63.0 3.0 2.0 1.0 31.0 16 14 1 100 72.7 27.3 粘土矿物与REE和LREE含量呈明显的正相关关系,与HREE相关性较弱(图 5)。相反,石英与REE含量呈明显的负相关关系(图 6)。与前人研究结果一致,煤系稀土元素主要赋存于粘土矿物中[21, 23, 27]。高岭石与REE和LREE含量呈弱的正相关关系,与HREE相关性很弱(图 7-a);然而,伊利石与REE和LREE含量呈明显正相关关系,相关系数分别为0.67和0.71,与HREE相关性一般,相关系数为0.45(图 7-b)。由此可知,稀土元素分馏作用明显,轻稀土元素较重稀土元素更加富集,而且在不同物质中富集强度不同。根据前人研究成果[16-18, 21],聚乎更矿区中侏罗统木里组沉积环境为河流-三角洲-沼泽相,自生高岭石发育,伊利石来源于陆源碎屑矿物,对稀土元素的吸附作用更强。顶底板泥岩稀土元素分配模式中,Eu呈现明显的“V”型,表明泥岩沉积时陆源碎屑供给稳定,沉积环境变化较小。
![]() 图 5 下1煤层顶底板泥岩中粘土矿物含量与REE、LREE和HREE含量关系Figure 5. The relationship between clay mineral content and REE, LREE and HREE content in mudstone of roof and floor from the No.1 coal
图 5 下1煤层顶底板泥岩中粘土矿物含量与REE、LREE和HREE含量关系Figure 5. The relationship between clay mineral content and REE, LREE and HREE content in mudstone of roof and floor from the No.1 coal![]() 图 6 下1煤顶底板泥岩中石英含量与稀土元素含量相关性Figure 6. The relationship between quartz content and REE content in mudstone of roof and floor from the No.1 coal
图 6 下1煤顶底板泥岩中石英含量与稀土元素含量相关性Figure 6. The relationship between quartz content and REE content in mudstone of roof and floor from the No.1 coal![]() 图 7 下1煤顶底板泥岩中高岭石含量(a)和伊利石含量(b)与REE, LREE和HREE含量关系Figure 7. The relationship between kaolinite(a)and illite(b)content, and REE, LREE and HREE content in mudstone of roof and floor from the No.1 coal
图 7 下1煤顶底板泥岩中高岭石含量(a)和伊利石含量(b)与REE, LREE和HREE含量关系Figure 7. The relationship between kaolinite(a)and illite(b)content, and REE, LREE and HREE content in mudstone of roof and floor from the No.1 coal3.5 煤中稀土元素的富集成因
煤中稀土元素的来源主要包括陆源碎屑、火山灰和热液流体[29],陆源碎屑是主要物质来源[4]。稀土元素富集类型主要有:通过地表水淋滤渗流后在煤中富集;由降落的酸性和碱性火山灰及火山灰的渗滤作用形成;由含矿热液及深层流体上升流动引起[6];主要与煤中硅酸盐矿物结合[30],赋存于以高岭石、伊利石为主的粘土矿物中。粘土矿物在成煤环境中对于吸附稀土元素起重要作用[31]。稀土元素与有机质可形成络合物,赋存于有机质中,呈有机态结合[32]。
本文对聚乎更矿区下1煤中稀土元素进行分析发现以下特点。
(1)δEu的平均值为0.74,呈现负Eu异常,受陆源控制的煤层一般具有负Eu异常,Eu异常也可反映母岩的特质[1]。聚乎更矿区下1煤层顶底板与煤中稀土元素分配模式相似,表明成煤期物源一致,受成岩和后生作用的影响,发生轻微的分异。Dai等[21]对聚乎更矿区木里组煤中微量元素和矿物组成进行研究,认为成煤期物源主要来源于上三叠统,未发现火山灰相关的矿物组成。表明聚乎更矿区煤中稀土元素与陆源岩关系密切。
凝胶化指数(GI)反映泥炭沼泽的覆水程度和植物残体的凝胶化程度;结构保存指数(TPI)可用于指示泥炭的降解程度和埋藏速度。煤岩显微组分TPI-GI图解显示(图 8),成煤环境主要为芦苇草沼,为还原环境,与Eu异常指示的还原环境一致。聚乎更矿区下1煤稀土元素含量较低,相对不富集,表明虽然接受了陆源碎屑的供给,但总体供给不足;煤中灰分平均值仅为9.30%,整体属于低灰煤,也从另一个角度反映陆源碎屑供给的不足。δCe值范围为0.28~1.01,平均值为0.82,呈现Ce弱负异常,可能与其处于强的还原环境有关。
(2) 从表 4可以看出,聚乎更矿区下1煤中稀土元素总量与煤中灰分呈中等正相关关系(R=0.481);与SiO2呈较强的正相关关系(R=0.652),表明煤中部分稀土元素以无机态形式赋存,与硅酸盐矿物相结合,主要赋存于粘土矿物中[30]。煤中稀土元素赋存形式与顶底板泥岩中一致,主要赋存于粘土矿物中。聚乎更矿区下1煤中稀土元素主要以无机矿物为载体赋存,这与Dai等[21]研究木里煤田煤中稀土元素的成因结论一致。
表 4 灰分、主量元素与稀土元素相关关系Table 4. The relationship between ash, major elements and rare earth elements组分 Ad K2O Na2O SiO2 Al2O3 Fe2O3 CaO MgO SO3 MnO2 P2O5 TiO2 REE Ad 1.000 K2O -0.863** 1.000 Na2O -0.738** 0.190 1.000 SiO2 0.055 0.522* -0.049 1.000 Al2O3 -0.773** 0.236 0.474 -0.184 1.000 Fe2O3 0.245 -0.333 -0.101 -0.696** -0.311 1.000 CaO 0.318 -0.689** 0.071 -0.613** -0.311 0.640** 1.000 MgO 0.327 -0.467 -0.044 -0.632** -0.422 0.833** 0.880** 1.000 SO3 -0.347 -0.532* 0.245 -0.255 0.081 0.244 0.598* 0.430 1.000 MnO2 0.351 -0.052 -0.390 -0.343 -0.603* 0.754** 0.413 0.692** -0.256 1.000 P2O5 / 0.899* 0.257 -0.886* 0.371 0.886* 0.143 0.143 -0.821 0.486 1.000 TiO2 -0.136 -0.140 0.411 0.005 0.390 -0.017 0.025 -0.015 0.701** -0.446 0.657 1.000 REE 0.481 0.668** -0.278 0.652** -0.118 -0.392 -0.696** -0.547* -0.679** 0.048 0.829* -0.275 1.000 注:**在置信度(双测)为0.01时,相关性是显著的;*在置信度(双测)为0.05时,相关性显著 (3) 聚乎更矿区下1煤中垂向上稀土元素含量有一定的差异(表 1),上部煤层稀土元素含量明显高于下部煤层,一方面可能由于成煤泥炭沼泽水体变化引起;另一方面可能受后期热液淋滤富集作用影响,从图 9可以看出,菱铁矿和脉状型黄铁矿为后期受热液充填形成,所以热液可能对稀土元素的淋滤富集有一定的影响。
![]() 图 9 聚乎更矿区下1煤层无机矿物显微组分a—菱铁矿;b—脉状充填型黄铁矿Figure 9. Inorganic maceral of in the No.1 coal from Juhugeng coal district
图 9 聚乎更矿区下1煤层无机矿物显微组分a—菱铁矿;b—脉状充填型黄铁矿Figure 9. Inorganic maceral of in the No.1 coal from Juhugeng coal district(4) 煤中δCe/δEu可以反映氧化还原条件,低的δCe/δEu值反映了氧化条件,高值则反映了还原条件[4]。从图 10可以看出,聚乎更矿区下1煤中δCe/δEu值一般大于0.5小于2.6,平均值为1.3,表明成煤环境的还原条件。REE-δCe/δEu的投点离散度大,反映了陆相成煤环境的非均一性和复杂性,从而导致煤中稀土元素分配模式曲线不完全重合。
![]() 图 10 稀土元素含量与δCe/δEu相关图解Figure 10. The correlation diagram of the content of rare earth elements with the δCe/δEu value
图 10 稀土元素含量与δCe/δEu相关图解Figure 10. The correlation diagram of the content of rare earth elements with the δCe/δEu value4. 结论
(1) 聚乎更矿区下1煤中REE质量分数为5.23×10⁻⁶~55.79×10⁻⁶,平均值23.01×10⁻⁶,明显低于中国煤中的REE质量分数平均值(135.89×10⁻⁶)和世界煤中的平均值(68.47×10⁻⁶),表明聚乎更矿区下1煤中稀土元素含量总体不高,相对不富集。然而,煤层顶底板泥岩中稀土元素较富集,尤其是轻稀土元素含量在72.7×10⁻⁶~210.6×10⁻⁶之间,平均值为157.3×10⁻⁶;重稀土元素范围为27.3×10⁻⁶~58.6×10⁻⁶,平均值为41.3×10⁻⁶。LREE/HREE平均值为3.8,说明轻稀土元素较重稀土元素富集。
(2) 顶底板与煤中稀土元素分配模式相似,表明成煤期物源一致,受成煤沼泽水体变化和热液作用的影响,稀土元素含量发生轻微的分异,煤中稀土元素与陆源岩关系密切。煤中负Eu异常明显,成煤环境主要为芦苇草沼,为还原环境,与Eu异常指示的还原环境一致。
(3) 煤中稀土元素总量与煤中灰分呈中等正相关关系(R=0.481);与SiO2呈较强的正相关关系(R=0.652),表明煤中部分稀土元素以无机态形式赋存于粘土矿物中。下1煤层顶底板泥岩中稀土元素与粘土矿物呈正相关,与石英含量呈负相关关系;其中伊利石比高岭石对稀土元素的吸附性、结合性更强。
致谢: 感谢同济大学赵金鹏、王晓慧、苏建锋同学对采样及室内实验工作的帮助,感谢中国极地研究中心毕磊助理研究员对本文图件制作的指导。 -
![]()
图 1 长江流域主要水系(a)和长江口及周边海域表层沉积物分布特征(b,据参考文献[28]修改)
(其他文献中用于古洪水研究的5个短柱样位置(A[29]、Cj0702[9]、S5-2[20]、DH3-2、DH3-3[11]);a图中红色虚线表示南亚夏季风(SASM)和东亚夏季风(EASM)主要影响区域的分界线(据参考文献[30]修改))
Figure 1. Major tributaries of the Yangtze River system (a)and grain-size distribution pattern of surface sediments in the Yangtze Estuary and adjacent seas (b)
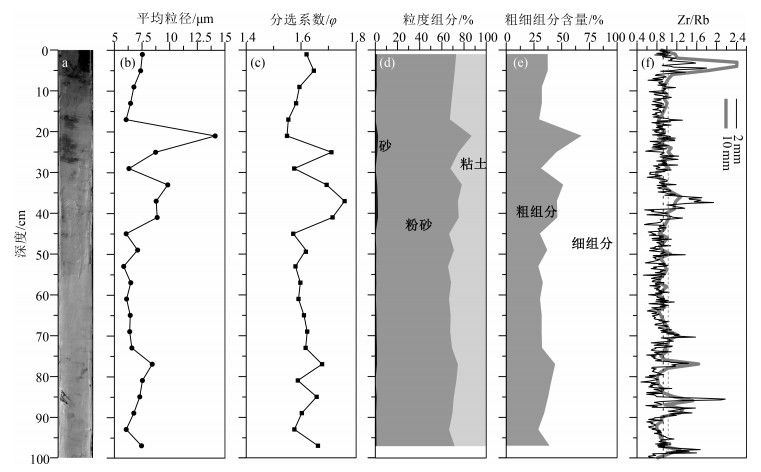
![]()
图 2 YEC1701柱状样沉积物岩性、粒度特征、敏感组分与Zr/Rb值的垂向变化
Figure 2. Downcore variations of the lithology, grain size parameters, sensitive grain populations, and Zr/Rb ratio in core YEC1701
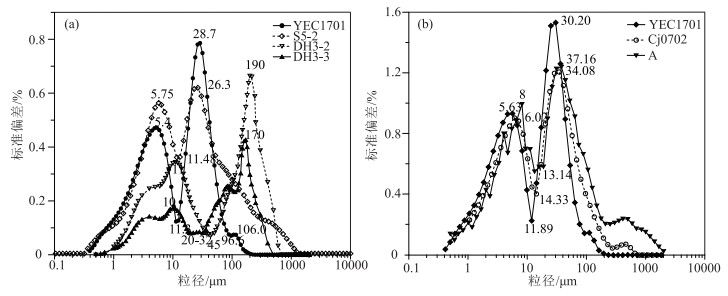
![]()
图 3 柱状样沉积物粒级-标准偏差曲线对比(其他柱样位置和数据来源详见图 1)
a—单粒径测量通道(0.135 φ);b—双粒径测量通道(0.27 φ)
Figure 3. Grain size-standard deviation curves of sediment cores in the Yangtze Delta with different statistical intervals
![]()
图 4 YEC1701柱状样有机元素和碳同位素组成变化
Figure 4. Variations of organic elements and stable carbon isotope (δ13C)in core YEC1701
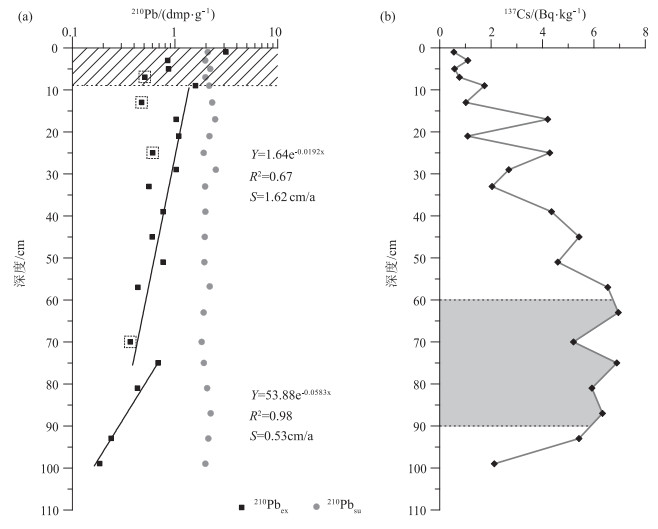
![]()
图 5 YEC1701柱状样210Pb(a)和137Cs(b)深度剖面特征(a中斜线框标示顶部混合层;b中灰色框标示137Cs蓄积峰范围)
Figure 5. 210Pb (a)and 137Cs (b)concentration profiles and accumulation rate calculated from core YEC1701
![]()
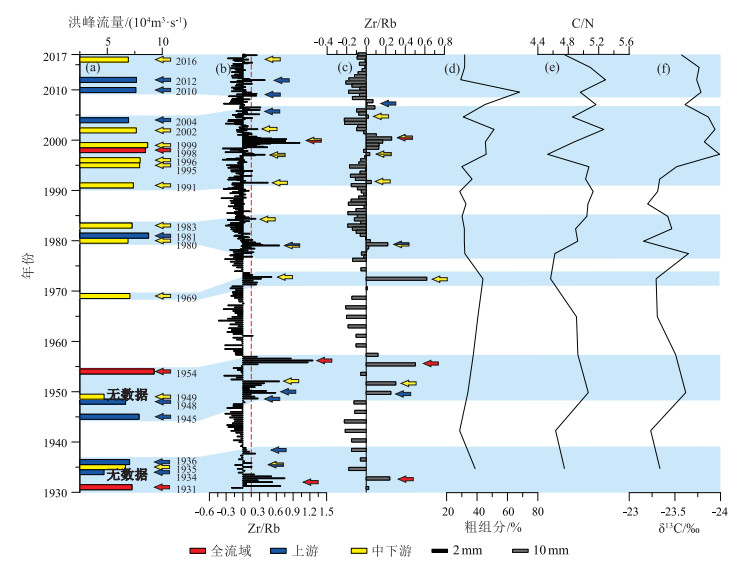
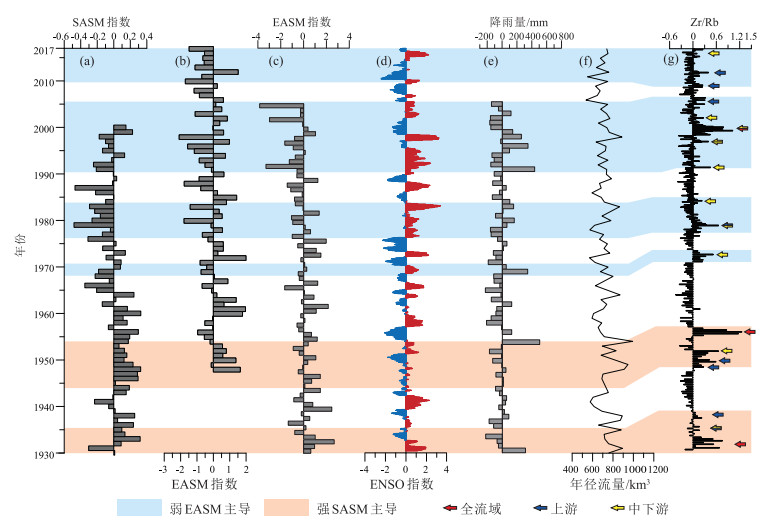
![]()
图 8 1930—2017年YEC1701柱样沉积物Zr/Rb距平值与气候变化、降雨量及长江年径流量对比
(SASM指数(a,据参考文献[65])、EASM指数(b、c分别据参考文献[68]和[69])、ENSO指数(d,https://www.esrl.noaa.gov/psd/enso/mei)、长江中下游流域梅雨带降水量(e,据参考文献[70])及长江年径流量(f,1930—2005年数据据参考文献[71];2006—2017年数据据参考文献[72]);蓝色阴影区域表示上游和全流域洪水多发期,橘色阴影区域表示中下游洪水多发期)
Figure 8. Comparison of Zr/Rb anomaly valueswith climate change, the precipitation records and annual water discharge of the Changjiang river
表 1 长江流域历史洪水信息
Table 1 Historical floods of Yangtze River
年份 洪峰流量/(m3·s-1) 水文站 区域 参考文献 2016 61300 汉口 中下游 [40] 2012 71200 三峡入库 上游 [41] 2010 70000 宜昌 上中游 [42] 2004 61100 宜昌 上游 [43] 2002 70300 汉口 中下游 [44] 1999 84500 大通 中下游 [4] 1998 81700 大通 全流域 [4] 1996 75200 大通 中游 [4] 1995 74500 大通 中下游 [4] 1991 66700 汉口 下游 [4] 1983 65000 汉口 中游及汉江流域 [4] 1981 85700 寸滩 上游 [4] 1980 60100 汉江 中下游 [4] 1969 62400 汉口 中下游 [4] 1954 92600 大通 全流域 [4] 1949 - - 中下游 [4] 1948 57000 宜昌 上游 [45] 1945 73800 寸滩 上游 [4] 1936 62000 宜昌 上游 [45] 1935 56900 宜昌 中游 [46] 1934 - - 上游 [4] 1931 65000 宜昌 全流域 [45]  下载: 导出CSV
-
Schulte L, Schillereff D, Santisteban J I, et al. Pluridisciplinary analysis and multi-archive reconstruction of paleofloods[J]. Global and Planetary Change, 2019: 103220. http://www.sciencedirect.com/science/article/pii/S0921818119301493
Schulte L, Schillereff D, Santisteban J I. Pluridisciplinary analysis and multi-archive reconstruction of paleofloods: Societal demand, challenges and progress[J]. Global Planet Change, 2019, 177: 225-238. doi: 10.1016/j.gloplacha.2019.03.019
CRED(The Centre for Research on the Epidemiology of Disasters) and UNDRR(United Nations Office for Disaster Risk Reduction). The human cost of disasters: an overview of the last 20 years(2000-2019)[EB/OL]. (2020). [2021-04-07]. UN Reports. https://www.undrr.org/publication/human-cost-disasters-2000-2019.
施雅风, 姜彤, 苏布达, 等. 1840年以来长江大洪水演变与气候变化关系初探[J]. 湖泊科学, 2004, (4): 289-297. doi: 10.3321/j.issn:1003-5427.2004.04.001 Jiang T, Zhang Q, Blender R, et al. Yangtze Delta floods and droughts of the last millennium: Abrupt changes and long term memory[J]. Theor. Appl. Climatol., 2005, 82(3/4): 131-141. doi: 10.1007/s00704-005-0125-4
Wang M J, Zheng H B, Xie X, et al. A 600-year flood history in the Yangtze River drainage: Comparison between a subaqueous delta and historical records[J]. Chin. Sci. Bull., 2011, 56(2): 188-195. http://www.ingentaconnect.com/content/ssam/10016538/2011/00000056/00000002/art00009
Kochel R C, Baker V R. Paleoflood hydrology[J]. Science, 1982, 215(4531): 353-361. doi: 10.1126/science.215.4531.353
JonesA F, Macklin M G, Brewer P A. A geochemical record of flooding on the upper River Severn, UK, during the last 3750 years[J]. Geomorphology, 2012, 179: 89-105. doi: 10.1016/j.geomorph.2012.08.003
Hu G, Li A, Liu J, et al. High resolution records of flood deposition in the mud area off the Changjiang River mouth during the past century[J]. Chin. J. Oceanol. Limn., 2014, 32(4): 909-920. doi: 10.1007/s00343-014-3244-x
Barbara L, Schmidt S, Urrutia-Fucugauchi J, et al. Fuerte River floods, an overlooked source of terrigenous sediment to the Gulf of California[J]. Cont. Shelf Res., 2016, 128: 1-9. doi: 10.1016/j.csr.2016.09.006
Zhang K, Li A, Zhang J, et al. Recent sedimentary records in the East China Sea inner shelf and their response to environmental change and human activities[J]. Chin. J. Oceanol. Limn., 2018, 36(5): 81-99.
Dypvik H, Harris N B. Geochemical facies analysis of fine-grained siliciclastics using Th/U, Zr/Rb and(Zr+Rb)/Sr ratios[J]. Chem. Geol., 2001, 181(1): 131-146. http://www.sciencedirect.com/science/article/pii/S0009254101002789
Croudace I W, Rothwell R G. Micro-XRF Studies of Sediment Cores[J]. Series: Developments in Paleoenvironmental Research, 2015, 17: 1-236. doi: 10.1007/978-94-017-9849-5_1
Liu L, Chen J, Ji J, et al. Variation of Zr/Rb ratios on the Loess Plateau of Central China during the last 130000 years and its implications for winter monsoon[J]. Chin. Sci. Bull., 2002, 47(15): 1298-1302. doi: 10.1360/02tb9288
水利部长江水利委员会长江泥沙公报. [M]. 北京: 长江出版社, 2019. Kundzewicz Z W, Huang J, Pinskwar I, et al. Climate variability and floods in China-A review[J]. Earth-Science Reviews, 2020, 211: 103434. doi: 10.1016/j.earscirev.2020.103434
王晨曦. 应急管理部: 今年洪涝灾害造成直接经济损失2143.1亿元[EB/OL]. (2020-09-03). [2021-04-07]. 中国网财经. http://finance.china.com.cn/news/20200903/5358440.shtml. Su J, Fan D. Internal Facies Architecture and Evolution History ofChangxing Mouth-Bar Complex in the Changjiang(Yangtze) Delta, China[J]. J. Ocean U. China, 2018, 6: 1281-1289. http://kns.cnki.net/KCMS/detail/detail.aspx?dbcode=CJFD&filename=QDHB201806003
Middelkoop H, Erkens G, Van der Perk M. The Rhine delta-a record of sediment trapping over time scales from millennia to decades[J]. J. Soils Sediments, 2010, 10: 628-639. doi: 10.1007/s11368-010-0237-z
Zhao Y, Zou X, Gao J, et al. Recent sedimentary record of storms and floods within the estuarine-inner shelf region of the East China Sea[J]. The Holocene, 2016, 27(3): 439-449. http://adsabs.harvard.edu/abs/2017Holoc..27..439Z
Tian Y, Fan D, Zhang X, et al. Event deposits of intense typhoons in the muddy wedge of the East China Sea over the past 150 years[J]. Mar. Geol., 2019, 410: 109-121. doi: 10.1016/j.margeo.2018.12.010
展望, 杨守业, 刘晓理, 等. 长江下游近代洪水事件重建的新证据[J]. 科学通报, 2010, 55(19): 1908-1913. https://www.cnki.com.cn/Article/CJFDTOTAL-KXTB201019010.htm Hedges J I, Keil R G, Benner R. What happens to terrestrial organic matter in the ocean[J]. Org. Geochem., 1997, 27(5/6): 195-212. http://www.sciencedirect.com/science/article/pii/S0304420304002130
Meyers P A. Organic geochemical proxies of paleoceanographic, paleolimnologic, and paleoclimatic processes[J]. Org. Geochem., 1997, 27(5/6): 213-250. http://www.sciencedirect.com/science/article/pii/S0146638097000491
Lamb A L, Wilson G P, Leng M J. A review of coastal palaeoclimate and relative sea-level reconstructions using δ13C and C/N ratios in organic material[J]. Earth-Sci. Rev., 2006, 75: 29-57. doi: 10.1016/j.earscirev.2005.10.003
陈吉余, 沈焕庭, 恽才兴. 长江河口动力过程和地貌演变[M]. 上海: 上海科学技术出版社, 1988. 火苗, 范代读, 陆琦, 等. 长江口南汇边滩冲淤变化规律与机制[J]. 海洋学报, 2010, 32(5): 41-51. https://www.cnki.com.cn/Article/CJFDTOTAL-SEAC201005006.htm Fan D. Open-Coast Tidal Flats[M]//Principles of Tidal Sedimentology, 2012: 187-229.
Fan D, Qi H, Sun X, et al. Annual lamination and its sedimentary implications in the Yangtze River delta inferred from High-resolution biogenic silica and sensitive grain-sizerecords[J]. Cont. Shelf Res., 2011, 31(2): 129-137. doi: 10.1016/j.csr.2010.12.001
Rao Z, Li Y, Zhang J, et al. Investigating the long-termpalaeoclimatic controls on the δD and δ18O of precipitation during the Holocene in the Indian and East Asian monsoonal regions[J]. Earth-Sci. Rev., 2016, 159: 292-305. doi: 10.1016/j.earscirev.2016.06.007
Chen Z, Song B, Wang Z, et al. Late Quaternary evolution of the sub-aqueous Yangtze Delta, China: sedimentation, stratigraphy, palynology, and deformation[J]. Mar. Geol., 2000, 162(2): 423-441. http://www.sciencedirect.com/science/article/pii/S002532279900064X
Liu J, Saito Y, Kong X, et al. Sedimentary record of environmental evolution off the Yangtze River estuary, East China Sea, during the last 13000 years, with special reference to the influence of the Yellow River on the Yangtze River delta during the last 600 years[J]. Quaternary Sci. Rev., 2010, 29(17): 2424-2438. http://www.sciencedirect.com/science/article/pii/S0277379110002106
Shang S, Fan D, Ying P, et al. Late Quaternary environmental change in the central-western East China Sea[J]. Palaeogeogr. Palaeocl., 2018, 492: 64-80. doi: 10.1016/j.palaeo.2017.12.012
Boulay S, Colin C, Trentesaux A, et al. Mineralogy and sedimentology of Pleistocene sediment in the South China Sea(ODP Site 1144)[C]//Prell W L, Wong P, Blum P, et al. Proc ODP, Sci. Res., 2003, 184: 1-21.
Sun Y, Gao S, Li J. Preliminary analysis of grain-size populations with environmentally sensitive terrigenous components in marginal seasetting[J]. Chin. Sci. Bull., 2003, 48(2): 184-187. doi: 10.1360/03tb9038
肖尚斌, 李安春. 东海内陆架泥区沉积物的环境敏感粒度组分[J]. 沉积学报, 2005, (1): 122-129. doi: 10.3969/j.issn.1000-0550.2005.01.016 王晓慧, 吴伊婧, 范代读. 福建兴化湾外近海210Pb法沉积速率及校正方法[J]. 古地理学报, 2019, 21(3): 527-536. https://www.cnki.com.cn/Article/CJFDTOTAL-GDLX201903013.htm Xing L, Zhang H, Yuan Z, et al. Terrestrial and marine biomarker estimates of organic matter sources and distributions in surface sediments from the East China Seashelf[J]. Cont. Shelf Res., 2011, 31(10): 1106-1115. doi: 10.1016/j.csr.2011.04.003
Luo X X, Yang S L, Zhang J. The impact of the Three Gorges Dam on the downstream distribution and texture of sediments along the middle and lower Yangtze River(Changjiang) and its estuary, and subsequent sediment dispersal in the East China Sea[J]. Geomorphology, 2012, 179: 126-140. doi: 10.1016/j.geomorph.2012.05.034
李妍清, 刘冬英, 熊莹. 2016年长江洪水遭遇分析[J]. 水资源研究, 2017(6): 568-576. 李文龙, 李鸿雁. 长江流域连续大洪水年机理分析及预报[J]. 水利水电技术, 2018, 49(5): 1-8. https://www.cnki.com.cn/Article/CJFDTOTAL-SJWJ201805001.htm 邹红梅, 陈新国. 2010年与1998年长江流域洪水对比分析[J]. 水利水电快报, 2011, (5): 15-17. doi: 10.3969/j.issn.1006-0081.2011.05.004 李春香, 张辰亮, 虞海平, 等. 长江宜昌"2004·9"暴雨洪水分析[J]. 人民长江, 2008, 39(18): 9-10, 26. doi: 10.3969/j.issn.1001-4179.2008.18.004 黄为, 冯忠民. 长江2002年洪水与1996年洪水的对比分析[J]. 人民长江, 2003, 34(4): 39-40. doi: 10.3969/j.issn.1001-4179.2003.04.017 乔盛西, 陈正洪. 历史时期川江石刻洪水资料的分析[J]. 暴雨灾害, 1999, 18(1): 4-7. https://www.cnki.com.cn/Article/CJFDTOTAL-HBQX199901001.htm Wang Z Y, Plate E J. Recent flood disasters inChina[J]. Water & Maritime Engineering, 2002, 154(3): 177-188. doi: 10.1680/maen.154.3.177.38719
Li X, Bianchi T S, Allison M A, et al. Historical reconstruction of organic carbon decay and preservation in sediments on the East China Seashelf[J]. J. Geophys. Res. Biogeo., 2013, 118(3): 1079-1093. doi: 10.1002/jgrg.20079
胡利民, 石学法, 王国庆, 等. 2011长江中下游旱涝急转前后河口表层沉积物地球化学特征研究[J]. 地球化学, 2014, (1): 39-54. https://www.cnki.com.cn/Article/CJFDTOTAL-DQHX201401005.htm 高抒, 贾建军, 杨阳, 等. 陆架海岸台风沉积记录及信息提取[J]. 海洋学报, 2019, 41(10): 141-160. doi: 10.3969/j.issn.0253-4193.2019.10.010 Xiao S, Li A, Liu J P, et al. Coherence between solar activity and the East Asian winter monsoon variability in the past 8000 years from Yangtze River-derived mud in the East China Sea[J]. Palaeogeogr. Palaeocl., 2006, 237: 293-304. doi: 10.1016/j.palaeo.2005.12.003
Moy C M, Seltzer G O, Rodbell D T, et al. Variability of El Niño/Southern Oscillation activity at millennial timescales during the Holocene epoch[J]. Nature, 2002, 420(6912): 159-162. doi: 10.1038/nature01163
D'Arrigo R, Cook E R, Wilson R J, et al. On the variability of ENSO over the past six centuries[J]. Geophys. Res. Lett., 2005, 32(3), L03711. doi: 10.1029/2004GL022055/full
MacDonald G M, Case R A. Variations in the Pacific Decadal Oscillation over the pastmillennium[J]. Geophys. Res. Lett., 2005, 32(8): L08703. doi: 10.1029/2005GL022478
张瑞, 汪亚平, 潘少明. 近50年来长江入海径流量对太平洋年代际震荡变化的响应[J]. 海洋通报, 2011, 30(5): 572-577. doi: 10.3969/j.issn.1001-6392.2011.05.016 Zhang Q, Xu C, Jiang T, et al. Possible influence of ENSO on annual maximum streamflow of the Yangtze River, China[J]. J. Hydrol., 2007, 333(2/4): 265-274. http://www.sciencedirect.com/science/article/pii/S002216940600429X
Qian W, Lin X, Zhu Y, et al. Climatic regime shift and decadal anomalous events in China[J]. Climatic Change, 2007, 84(2): 167-189. doi: 10.1007/s10584-006-9234-z
Jiang T, Zhang Q, Zhu D, et al. Yangtze floods and droughts(China) and teleconnections with ENSO activities(1470-2003)[J]. Quatern. Int., 2006, 144: 29-37. doi: 10.1016/j.quaint.2005.05.010
Chen J, Chen F, Feng S, et al. Hydroclimatic changes in China and surroundings during the Medieval Climate Anomaly and Little Ice Age: spatial patterns and possible mechanisms[J]. Quaternary Sci. Rev., 2015, 107: 98-111. doi: 10.1016/j.quascirev.2014.10.012
Kim H J, Hyeong K, Yoo C M, et al. Impact of strong El Niño events(1997/98 and 2009/10) on sinking particle fluxes in the 10°N thermocline ridge area of the northeastern equatorial Pacific[J]. Deep Sea Res., Part Ⅰ, 2012, 67(0): 111-120. http://www.dbpia.co.kr/Article/2757500
Zhu Z, Feinberg J M, Xie S, et al. Holocene ENSO-related cyclic storms recorded by magnetic minerals in speleothems of central China[J]. Proc. Natl. Acad., USA, 2017, 114(5): 852-857. doi: 10.1073/pnas.1610930114
Kundzewicz Z W, Szwed M, Pińskwar I. Climate Variability and Floods-A global Review[J]. Water, 2019, 11(7): 1399. doi: 10.3390/w11071399
Guo Y, Huang C C, Zhou Y, et al. Extraordinary flood events and the response to monsoonal climatic change during the last 3000 years along the middle Yangtze River valley, China[J]. Palaeogeogr. Palaeocl., 2016, 462: 70-84. doi: 10.1016/j.palaeo.2016.09.005
Liu H, Gu Y, Huang X, et al. A 13000-year peatland palaeohydrological response to the ENSO-related Asian monsoon precipitation changes in the middle Yangtze Valley[J]. Quaternary Sci. Rev., 2019, 212: 80-91. doi: 10.1016/j.quascirev.2019.03.034
Shen C, Wang W C, Gong W, et al. A Pacific Decadal Oscillation record since 1470 AD reconstructed from proxy data of summer rainfall over easternChina[J]. Geophysical Research Letters, 2006, 33(3): L03702. doi: 10.1029/2005GL024804/full
Shi F, Li J, Wilson R J. A tree-ring reconstruction of the South Asian summer monsoon index over the pastmillennium[J]. Sci. Rep., 2014, 4: 6739. http://www.nature.com/articles/srep06739
Xu K, Li A, Liu J P, et al. Provenance, structure, and formation of the mud wedge along inner continental shelf of the East China Sea: A synthesis of the Yangtze dispersalsystem[J]. Mar. Geol., 2012, 291-294: 176-191. doi: 10.1016/j.margeo.2011.06.003
Wang Z, Wei G, Chen J, et al. El Niño-Southern Oscillation variability recorded in estuarine sediments of theChangjiang River, China[J]. Quaternary International, 2017, 441: 18-28. doi: 10.1016/j.quaint.2016.07.009
李建平, 曾庆存. 一个新的季风指数及其年际变化和与雨量的关系[J]. 气候与环境研究, 2005, (3): 351-365. https://www.cnki.com.cn/Article/CJFDTOTAL-QHYH200503008.htm IPCC. Climate change 2007: the physical science basis[C]//Solomon S, Qin D, Manning M, et al. Contribution of Working Group I to the Fourth Assessment Report of Intergovernmental Panel on Climate Change. Cambridge University Press, Cambridge New York, 2007: 1-297.
Ding Y, Wang Z, Sun Y. Inter-decadal variation of the summer precipitation in East China and its association with decreasing Asian summermonsoon. Part Ⅰ: Observed evidences[J]. Int. J. Climatol., 2008, 28(9): 1139-1161. doi: 10.1002/joc.1615
Wang H, Yang Z, Wang Y, et al. Reconstruction of sediment flux from theChangjiang(Yangtze River) to the sea since the 1860s[J]. J. Hydrol., 2008, 349(3/4): 318-332.
长江泥沙公报. 水利部长江水利委员会[M]. 北京: 长江出版社, 2006-2017. Liu J, Chen J, Zhang X, et al. Holocene East Asian summer monsoon records in northern China and their inconsistency with Chinese stalagmite δ18O records[J]. Earth-Science Reviews, 2015, 148: 194-208. doi: 10.1016/j.earscirev.2015.06.004
葛兆帅. 长江上游全新世特大洪水对西南季风变化的响应[J]. 地理研究, 2009, 28(3): 592-600. doi: 10.3321/j.issn:1000-0585.2009.03.004 Guo Y, Huang C C, Pang J, et al. Investigating extreme flood response to Holocene palaeoclimate in the Chinese monsoonal zone: A palaeoflood case study from the Hanjiang River[J]. Geomorphology, 2015, 238: 187-197. doi: 10.1016/j.geomorph.2015.03.014
周秀骥, 赵平, 刘封, 等. 中世纪暖期、小冰期与现代东亚夏季风环流和降水年代-百年尺度变化特征分析[J]. 科学通报, 2011, 56(25): 2060-2067. https://www.cnki.com.cn/Article/CJFDTOTAL-KXTB201125005.htm


计量
- 文章访问数: 3046
- HTML全文浏览量: 319
- PDF下载量: 1662
