Recovery of original quality characteristics and estimation of hydrocarbon expulsion of upper paleozoic source rocks in the Sishen 1 well area, Songliao Basin
-
摘要:
松辽盆地四深1井区基底古生界已发现天然气,但是烃源岩有机质热演化程度高,仅依据现今残余的有机质丰度和生烃潜力参数会极大降低烃源岩评价的准确性,误导油气远景的评估。利用岩石热解参数、有机碳同位素、镜质体反射率及有机显微组分等实验数据,通过多种方法恢复烃源岩原始有机质丰度及生烃潜力,确定降解率法的恢复结果可靠,进一步结合生烃潜力法分析热演化过程中烃源岩的排烃特征。结果表明,四深1井区古生界烃源岩大部分为Ⅰ型和Ⅱ1型有机质,恢复后的原始有机碳(TOC)平均值为2.56%,原始热解烃量(S2)平均值为16.11 mg/g,恢复后的原始烃源岩品质达到好—极好级别。基于Ⅰ和Ⅱ1型有机质热演化过程中烃源岩的排烃量曲线,得出四深1井区上古生界烃源岩在三叠纪早期(约230 Ma)进入排烃门限(Ro=0.7%),在三叠纪晚期(约210 Ma)到达排烃高峰(Ro=1.1%),原油主要成藏阶段在三叠纪—侏罗纪早期(230~200 Ma),排烃量为416.423×10⁸ t。主要成气期在侏罗纪中晚期阶段(200~165 Ma),排烃量为55.093×10⁸ t。研究表明,四深1井区上古生界烃源岩已经为油气藏的形成提供了丰富的烃源。
Abstract:Natural gas has been discovered in the basement of the Paleozoic strata in the Sishen 1 well area of the Songliao Basin. However, the organic matter in the source rocks was in the over mature stage. Based on residual TOC and rock pyrolysis, the evaluation accuracy of source rock was reduced significantly, and it could result in erroneous assessments of the oil and gas exploration potential. A bulk of experimental data encompassing rock pyrolysis parameters, isotopic ratios of organic carbon, vitrinite reflectance, organic maceral components and multiple recovery methodologies were employed to restore the original organic matter content and hydrocarbon generation potential of the Paleozoic source rocks. The degradation rate method was selected as the most reliable recovery method based on the recovery results. Subsequently, the expulsion characteristics of the source rocks throughout the thermal maturation process were analyzed, leveraging the hydrocarbon potential method. The findings indicated that the majority kerogen type of Paleozoic source rocks in the Sishen 1 well area were classified as Type I and Type II1. The average original total organic carbon (TOC) content was 2.56%, while the average original S2 value was calculated to be 16.11 mg/g. Consequently, the quality of the original source rocks was good to excellent. According to the hydrocarbon expulsion curves of I and II1 kerogen during thermal evolution, the Paleozoic source rocks in the Sishen 1 well area were found to have entered the hydrocarbon expulsion threshold during the Early Triassic (approximately 230 Ma), characterized by a vitrinite reflectance (Ro) value of 0.7%, and the peak of hydrocarbon expulsion was attained in the Late Triassic (approximately 210 Ma), with an Ro value of 1.1%. Oil accumulation was occurred from the Early Triassic to the Early Jurassic (approximately 230 Ma to 200 Ma), with an estimated expulsion volume of 416.423×10⁸ t. Then, gas generation was happened during the Middle to Late Jurassic (approximately 200 Ma to 165 Ma), with an expulsion volume recorded at 55.093×10⁸ t. The study has shown that that the Upper Paleozoic source rocks in the Sishen 1 well area have provided abundant source of hydrocarbons for the formation of oil and gas reservoirs.
-
深层油气资源潜力巨大,随着中浅层油气勘探开采进入末期阶段,中国加大了对深层油气的勘探力度(Craig et al., 2008; Jia et al., 2015; Zhu et al., 2019; Schwangler et al., 2020; Shi et al., 2020; Xiao et al., 2021)。然而,由于深部烃源岩经历了多期次构造事件和长时间的热演化,有机质大多处于高熟—过成熟阶段,难以确定其原始生烃潜力(Jarvie et al., 2007)。此外,对于已经基本彻底排烃的高熟—过成熟烃源岩,根据样品实测数据对其进行品质评价也容易出现误差(庞雄奇等, 2014),因此有必要对烃源岩原始有机质丰度及生烃潜力进行恢复。目前恢复高熟—过成熟烃源岩原始特征引起广泛重视,许多学者提出了一系列方法,如降解率法、化学动力法、干酪根恢复系数法、正演法、反演法等(金强, 1989; 卢双舫等, 1995; 程克明等, 1996; Niu et al., 2023),由于地质资料、烃源岩特征等差异,导致这些方法在不同地区有不同的适用程度,需要进行甄别。
松辽盆地古生界广泛发育高熟—过成熟烃源岩,石炭系—二叠系气测结果显示高含气量,如四深1井上古生界发现8个含气层段(任收麦等, 2011),气源均为上古生界烃源岩,表明上古生界烃源岩是有效的烃源岩,且具有厚度大、分布广、有机质丰度较高和彻底生烃的特点,因此急需开展原始烃源岩特征恢复并对其初始品质进行评价,为排烃量的估算提供必要参数。本次将通过降解率法、化学动力法、干酪根恢复系数法、正演法、反演法等多种方法对松辽盆地四深1井区古生界烃源岩进行原始有机质丰度及生烃潜力的恢复,并估算其排烃量,为松辽盆地基底油气成藏潜力评估提供依据。
1. 区域地质概括
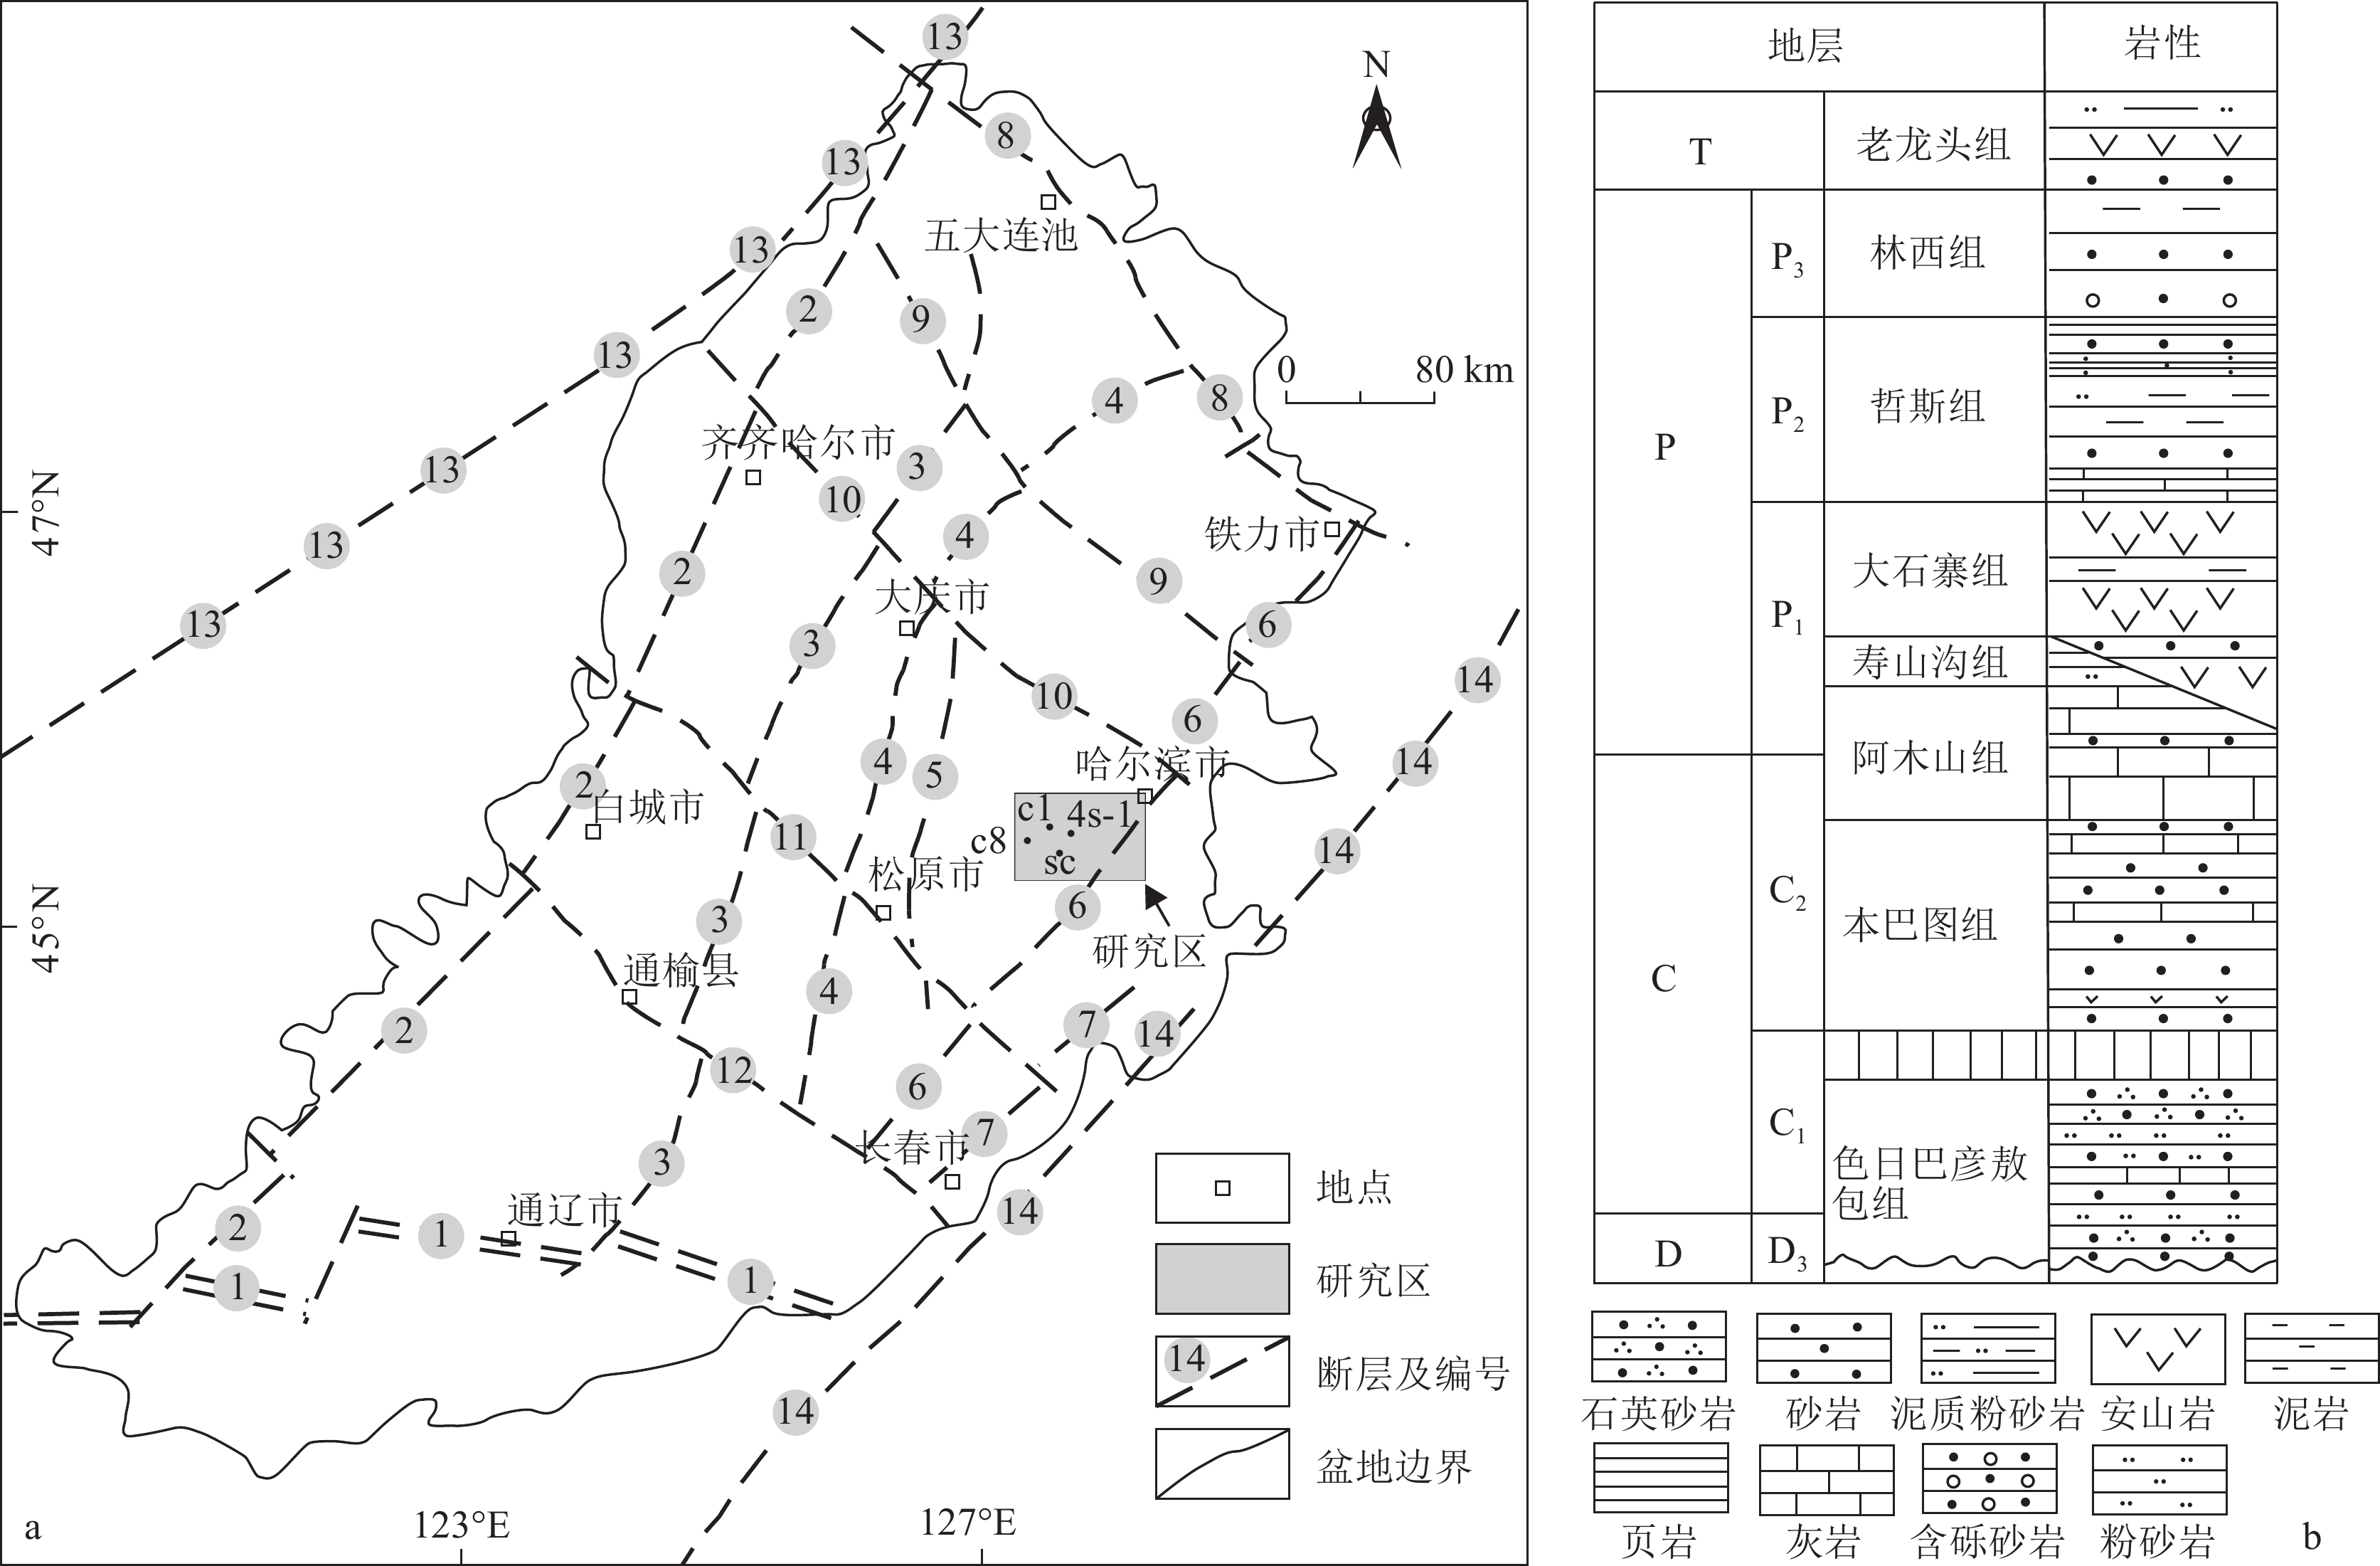
松辽盆地是一个规模较大的NNE向似菱形中—新生代陆相含油气盆地,面积26×104 km2(Jia et al., 2013; Song et al., 2014)。它位于古亚洲洋、蒙古–鄂霍茨克洋和古太平洋3个构造域的叠合区(Zhu et al., 2012; Fu et al., 2021)。 松辽盆地北部以小兴安岭为界,东、西部分别由大兴安岭和张广才岭夹持组成“两山夹一盆”的盆山体系。大量研究表明,盆地基底为海西期褶皱基底,具有“早断晚坳”的二元结构,下部为断陷盆地,上部为坳陷盆地(Song et al., 2018)。松辽盆地基底主要发育12条基底骨架断裂(图1),以NE向和NW向为主,基本控制了盆地内部断陷带的展布。
本次研究的四深1井区在莺山—双城地区,地理位置上位于黑龙江省哈尔滨市西部、肇东市南部、肇源县东部、第二松花江北部(图1),研究区东西长66.3 km,南北宽45.8 km,面积3036.54 km2。
松辽盆地北部已有50多口钻井揭示发育上古生界,目前已确定主要为二叠系。二叠系自下而上划分为寿山沟组、大石寨组、哲斯组和林西组。本次研究的二叠系为林西组沉积,埋深为3480.5~4770.0 m(郑月娟等, 2018),岩性以灰黑色、黑色板岩、砂质板岩为主,夹变余砾岩和变余粉细砂岩薄层(朱德丰等, 2007)。
2. 样品与方法
2.1 取样及测试方法
由于松辽盆地钻井揭示基底岩心较少,本次对四深1井区揭示上古生界烃源岩的层位均进行了取样,以期尽量反映四深1井区上古生界烃源岩的特征,共获取39件烃源岩样品,岩性主要为泥岩、板岩、千枚岩,分别取自四深1井(23件,3835~4379 m)、朝深1井(1件,3035 m)、朝深8井(9件,3943.83~4243.08 m),尚深2井(6件,3162.25~3250.06 m),均为上二叠统林西组烃源岩层系。TOC、岩石热解、有机显微组分鉴定和镜质体反射率测试在吉林省油页岩与共生能源矿产重点实验室完成。
烃源岩样品有机质丰度评价参数包括TOC和PG(S1+S2)(生烃潜量,S1指游离烃量,S2指热解烃量)。将100 mg左右烃源岩粉末样品放置到低碳硫坩埚中(透水性好),加入浓度为5%的HCl去除无机矿物碳;然后,用蒸馏水清洗样品(pH=7)。使用LECOCS-230仪器测定TOC含量。使用Rock-Eval 6热解仪,按照标准程序,对重量约为50 mg的粉末样进行热解。每个粉末样品在高纯空气中以300~550℃的程序开温速率加热,得到S1、S2和Tmax。S1用火焰离子化检测器测定。S2为程序升温第二阶段,范围为300~600℃,S2的峰值温度对应Tmax。
采用AX-I蔡司透反射荧光显微镜及显微光度计进行有机显微组分鉴定和镜质体反射率测定,对有机质类型和成熟度进行分析。根据以下步骤确定烃源岩中有机物的类型:选择岩样制备直径大于20 mm的光片,保证有500多个有效测量点均匀覆盖整个光片,在显微镜下按照预定的线间距逐行统计有效物质,直至光片统计结束。采用镜质体反射率(Ro)测量方法测定烃源岩的有机物成熟度,具体步骤如下:采用双标准法校准仪器,使反射率误差小于 0.02%。使用无污垢和划痕的抛光光片,在油浸下测量最大反射率Rmax,测量点数不得少于20个。当镜质体颗粒很小时,可先测量随机反射率Rran,然后通过换算方法求得Rmax。
δ13CTOC在中国科学院广州地球化学研究所有机地球化学国家重点实验室测定。首先,将粉末样品进行稀盐酸处理,去除其中的碳酸盐组分,获得不含碳酸盐矿物的残余物;其次,将残余物置于Finnigan MAT 253同位素质谱仪进行分析测试,获得烃源岩样品的δ13CTOC值。
2.2 有机质恢复方法
目前常用的有机质恢复方法有6种。
(1)烃源岩降解率法,用于估算残余有机碳和生烃潜力,该方法通过降解率与镜质体反射率的关系计算恢复系数(程克明等, 1996),计算公式为:
Ks=KcDoDr,Kc=1−Dr1−Do (1) 式中,Ks为生烃潜力恢复系数,Kc为有机碳恢复系数,Dr为残余降解率,Do为原始降解率。
(2)基于物质平衡理论,确定TOC变化的定量模型,并建立TOC演化图版来评估烃源岩(庞雄奇等, 2014),计算公式为:
TOCo=1−∅o1−∅⋅ρrρro⋅(1+Rp⋅Ke⋅Kc)⋅TOCr (2) 式中,TOCo为原始有机碳含量(%),∅o和∅分别为初始和某阶段孔隙度(%);ρro和ρr为初始和某阶段密度(g/cm3);Rp表示有机母质的油气发生率(%);Kc表示烃源岩的排烃效率(%);Ke表示排出烃类的含碳系数(%),TOCr为现今检测的有机碳含量。
(3)化学动力学法,结合实验和地化指标,建立评价标准恢复烃源岩的有机质丰度(卢双舫等, 1995):
Pgo=Pg+(Pgo⋅Xo+Bo−B)+Pgo⋅Xg (3) Pgo=(Pg+Bo−B)/(1−Xo−Xg) (4) TOCo=TOC+(Pgo−Pg)⋅K/1000 (5) 式中,Pgo为原始生烃潜量(mg/g);Pg为现今检测的生烃潜量(mg/g);Bo为烃源岩中原生沥青的量(mg/g,即非干酪根热降解成因),可统计未熟样品获得;B为烃源岩中的残留油量,可通过热解数据S1代替(mg/g);Xo为干酪根成油转化率(%);Xg为干酪根成气转化率(%);TOCo为原始有机碳含量(%);TOC为现今检测的有机碳含量(%);K为将产物有机质转为有机碳的系数(即油气产物的含碳率,一般可取84%)。
(4)干酪根系数恢复法,通过已知的有机质类型和成熟度来计算原始有机碳含量(金强, 1989):
TOCo=(TOC−0.083A)⋅K (6) 式中,TOCo为原始有机碳含量(%);TOC为现今检测的有机碳含量(%);A为总抽提物质量,一般为氯仿沥青“A”,碳酸盐岩还包括沥青C;K为干酪根恢复系数,可通过镜质体反射率与干酪根恢复系数的关系回归求取K;上古生界烃源岩样品残余氯仿沥青“A”含量很低,因此本次计算忽略0.083A这部分的影响。
(5)正演热模拟法,基于实验测定未熟—低熟烃源岩热模拟过程中TOC和生烃潜力变化,建立了不同有机质类型的转化率模型(Niu et al., 2023):
Ⅰ型有机质:
TOCo=TOC(1−0.5) (7) S2o=7.06×TOC2,TOCo⩽ (8) {S}_{2o}=13.4\times {T}{O}{C},TOC_{o} > 3.5{\text{%}} (9) Ⅱ1型有机质:
{T}{O}{C}{_o}=\dfrac{TOC}{(1-0.4)} (10) {S}_{2o}=3.33\times {TOC}^{2},TOC_{o}\leqslant 3{\text{%}} (11) {S}_{2o}=8.3\times {T}{O}{C},TOC_{o} > 3{\text{%}} (12) Ⅱ2型有机质:
{T}{O}{C}{_o}=\dfrac{TOC}{(1-0.3)} (13) {S}_{2o}=2.04\times {TOC}^{2},TOC_{o}\leqslant 2{\text{%}} (14) {S}_{2o}=2.9\times {T}{O}{C},TOC_{o} > 2{\text{%}} (15) 式中,TOCo为原始有机碳含量(%);TOC为现今检测的有机碳含量(%),S2o为原始热解烃量(mg/g)。
(6)反演法,利用质量守恒法建立的模型推导出原始的TOC、HGP(生烃潜力指数)和HEP(排烃潜力指数)(Niu et al., 2023)。
Ⅰ型有机质:
\begin{split} & {T}{O}{C}{_o}=\dfrac{1-\sqrt{1-0.632{{TOC}}_{r}\times \left(1-\dfrac{0.83{e}^{-\left(\frac{Ro-3.30}{0.4}\right)}}{1000}\right)}}{0.316},\\ & {TOC}\leqslant 1.56\text{%} \end{split} (16) {T}{O}{C}{_o}={T}{O}{C}{_r}\times {k},{ }{T}{O}{C}{_r} > 1.56{\text{%}} (17) Ⅱ1型有机质:
\begin{split} & {T}{O}{C}{_o}=\dfrac{1-\sqrt{1-0.4TOC_{r}\times \left(1-\dfrac{0.83{{\mathrm{e}}}^{-\left(\frac{Ro-3.33}{0.44}\right)}}{1000}\right)}}{0.2},\\ & TOC_{r}\leqslant 2.10\text{%} \end{split} (18) {T}{O}{C}{_o}={T}{O}{C}{_r}\times {{{k}}},{ }{T}{O}{C}{_r} > 2.10{\text{%}} (19) Ⅱ2型有机质:
\begin{split} & {T}{O}{C}{_o}=\dfrac{1-\sqrt{1-0.322TOC_{r}\times \left(1-\dfrac{0.83{{\mathrm{e}}}^{-\left(\frac{Ro-3.20}{0.5}\right)}}{1000}\right)}}{0.166},\\ & TOC\leqslant 1.67\text{%} \end{split} (20) {T}{O}{C}{_o}={T}{O}{C}{_r}\times {{{k}}},{ }{T}{O}{C}{_r} > 1.67{\text{%}} (21) 式中,TOCo为原始有机碳含量(%);TOCr为现今检测的有机碳含量,k为干酪根恢复系数,Ro为镜质体反射率(%)。
这些方法可用于开展松辽盆地上古生界高熟—过熟烃源岩的原始有机质丰度恢复。
上述恢复方法均以热模拟实验为基础,因此模拟实验与实际地质条件的符合程度将直接影响恢复结果的准确性,而且基于不同地区获得参数的不同,各种方法之间的准确性也存在明显差别。因此,在对有机质丰度进行恢复时,应根据实际地质情况和资料的丰富程度,运用多种方法开展烃源岩原始品质特征恢复,并进行结果对比,优选出最合适的恢复方法,以保证恢复结果的准确性。
2.3 排烃量估算
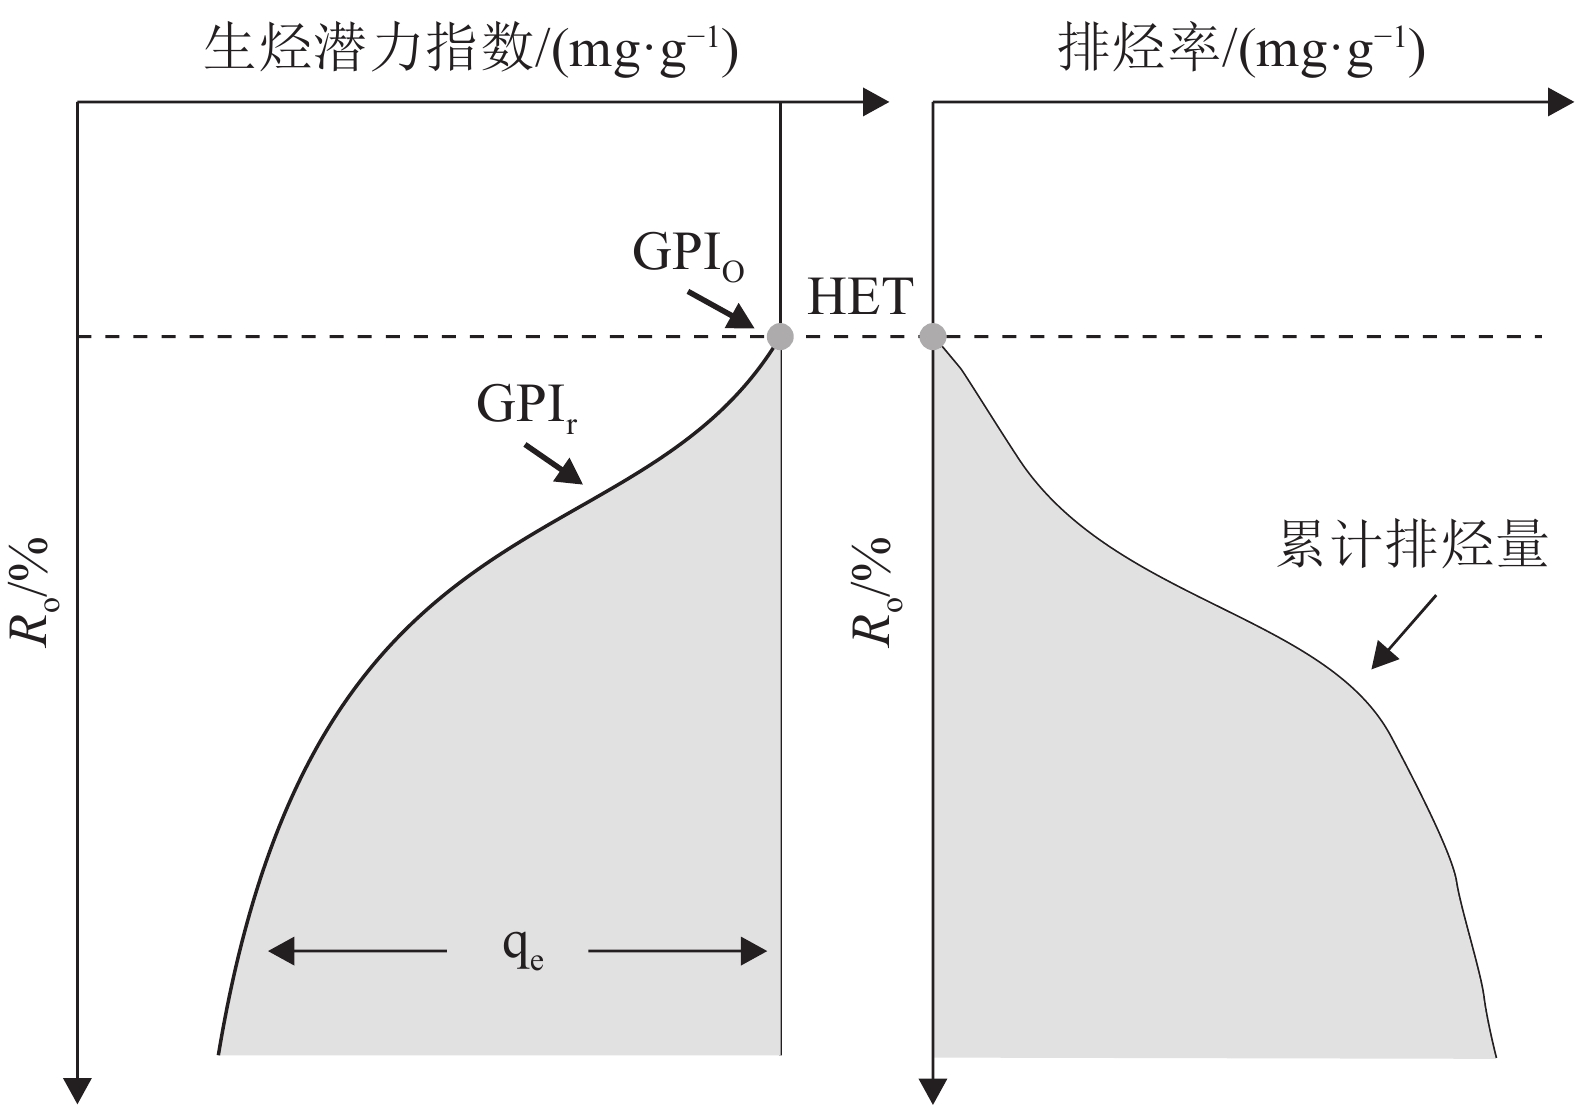
关于烃源岩生排烃特征已有较多研究,生烃潜力法是一种方便有效的方法。Pang et al.(2005)利用Rock-Eval数据集,提出了基于排烃门限(HET)和质量平衡法的生烃潜力法(图2),并在多个含油气盆地得到广泛应用(Peng et al., 2016; Bai et al., 2017; Zheng et al., 2019; Wang et al., 2020)。本文采用生烃潜力法研究松辽盆地四深1井区上古生界烃源岩的生排烃特征。
![]() 图 2 生排烃模式图(Pang et al., 2005)Figure 2. Pattern diagram of hydrocarbon expulsion from source rocks
图 2 生排烃模式图(Pang et al., 2005)Figure 2. Pattern diagram of hydrocarbon expulsion from source rocks根据物质平衡原理,从烃源岩中排出的烃类物质的量与残留在烃源岩中的烃类物质的量之和等于烃源岩的总生烃潜力。生烃潜力指数(GPI)定义为(S1+S2)/TOC,用来表征烃源岩的生烃潜力(Jiang et al., 2015)。排烃前GPI保持不变,此时代表原始生烃潜力(GPIo)。当烃类被排出烃源岩时,GPI开始降低,用剩余生烃指数(GPIr)指示剩余生烃潜力。排烃开始的地质条件是烃源岩的排烃门限(HET)(Pang et al., 2005)。排烃率(qe)定义为GPlo与GPIr之差,代表单位TOC排烃量(公式1)。生烃潜力(ge)等于GPIo,表示单位TOC的生烃量(公式2)。排烃速率(re)为单位时间内从烃源岩排出的油气量(公式3)(Li et al., 2021)。
\mathrm{q}\mathrm{e}\left({R}\mathrm{_o}\right)=\mathrm{G}\mathrm{P}\mathrm{I}_{\mathrm{o}}\left({R}\mathrm{_o}\right)-\mathrm{G}\mathrm{P}\mathrm{I}_{\mathrm{r}}\left({R}\mathrm{_o}\right) (22) \mathrm{g}\mathrm{e}\left({R}\mathrm{_o}\right)=\mathrm{G}\mathrm{P}\mathrm{I}_{\mathrm{o}}\left({R}\mathrm{_o}\right) (23) \mathrm{r}\mathrm{e}\left({R}\mathrm{_o}\right)=\dfrac{dqe}{dR_o} (24) 排烃强度和排烃量的对应公式为:
Ie={\int 10}^{-3}\cdot qe\left(R_o\right)\cdot H\cdot \rho \cdot TOC_o\left(R_o\right)d\left(R_o\right) (25) Qe={\int 10}^{-13}\cdot qe\left(R_o\right)\cdot H\cdot A\cdot \rho \cdot TOC_o\left(R_o\right)d\left(R_o\right) (26) 式中,H为烃源岩厚度(m),A为烃源岩面积(m2),ρ为烃源岩密度(g/cm3),Ie为排烃强度(104 t/km2),Qe为排烃量(108 t)。
3. 研究结果
3.1 烃源岩“残留”地球化学特征
3.1.1 有机质成熟度
热成熟度决定了干酪根的降解程度和生烃相态,对研究烃源岩的生排烃特征至关重要,沉积有机物的热成熟度通常是通过有机岩石学的Ro值和岩石热解参数Tmax值评估的(Peters et al., 1994)。但研究表明,当烃源岩样品过于成熟且S2过低(通常低于0.2 mg/g)时,Tmax常不准确(Cornford et al., 1998)。根据实测的地球化学参数(表1)可知,研究区样品的Tmax值范围为269~582℃时,平均值为393.97℃(N=39),且有74.4%的样品Tmax小于435℃,根据前人研究,当Tmax < 435℃时,烃源岩处于未成熟阶段(Espitalie, 1986; Baskin, 1997),这显然与研究区烃源岩的成熟度特征不符。因此本次研究采用Ro这一可靠参数评价烃源岩的成熟度,39个样品的实测Ro值为2.03%~2.96%,平均值为2.53%,表明四深1井区上古生界烃源岩均处于过成熟阶段。
表 1 样品实测地球化学参数Table 1. Measured geochemical parameters of the samples样品编号 TOC/% TC/% TS/% S1/(mg·g−1) S2/(mg·g−1) δ13CTOC/‰ Tmax/℃ Ro/% 4S-1 2.42 3.07 1.12 0.26 0.04 −28.05 409 2.13 4S-2 1.41 1.45 0.02 0.01 0.01 −29.66 350 2.79 4S-3 1.52 1.6 1.51 0.01 0.02 −30.15 433 2.90 4S-5 1.86 2.21 2.87 0.01 0.02 −27.11 340 2.87 4S-6 1.67 1.95 6.67 0.01 0.03 −28.18 429 2.92 4S-7 1.23 1.44 1.37 0.01 0.06 −28.95 439 2.55 4S-8 1.67 2.35 1.18 0.13 1.17 −29.2 434 2.88 4S-9 1.38 1.38 0.94 0.01 0.03 −28.97 440 2.63 4S-10 0.62 0.74 0.03 0.01 0.02 −27.52 434 2.44 4S-11 1.03 1.1 0.7 0.05 0.03 −27.91 469 2.13 4S-12 2.61 2.77 1.69 5.14 3.20 −28.08 427 2.2 4S-13 1.72 1.83 1.57 0.06 0.12 −27.74 425 2.27 4S-14 1.39 1.49 0.85 0.02 0.01 −27.33 278 2.79 4S-15 1.16 1.29 0.11 0.53 0.62 −28.41 372 2.20 4S-16 1.7 1.84 0.71 0.01 0.01 −27.64 412 2.96 4S-17 1.38 1.44 0.11 0.07 0.02 −27.92 277 2.45 4S-18 1.35 1.91 0.12 0.03 0.41 −27.67 435 2.12 4S-19 1.36 1.73 1.39 0.27 0.33 −27.82 379 2.52 4S-20 1.13 1.99 0.15 0.10 0.01 −27.71 269 2.68 4S-21 1.26 1.77 0.09 0.11 0.09 −27.87 327 2.70 4S-22 1.29 2 0.61 0.11 0.02 −29.29 277 2.84 4S-23 1.99 2.2 0.38 0.31 0.33 −26.98 395 2.2 4S-24 1.36 2.33 3.06 0.07 0.09 −26.74 410 2.6 C1-1 1.04 1.06 2.56 0.11 4.88 −30.01 428 2.5 C8-1 0.6 0.63 3.08 0.01 0.04 −29.6 344 2.67 C8-2 0.33 0.48 1.57 0.01 0.03 −32.23 447 2.68 C8-3 1.13 1.18 0.78 0.02 0.04 −28.92 436 2.1 C8-4 1.01 1.28 0.63 0.04 0.11 −26.76 374 2.68 C8-5 0.74 1.07 0.61 0.04 0.12 −25.83 415 2.03 C8-6 0.83 0.88 0.7 0.02 0.05 −28.29 440 2.67 C8-7 0.73 1.05 0.35 0.03 0.08 −27.64 397 2.32 C8-8 0.74 1.13 0.17 0.03 0.06 −28.5 311 2.17 C8-9 1.03 1.33 0.13 0.03 0.09 −30.24 399 2.70 SC-1 2.21 2.41 2.4 2.54 1.59 −28.48 440 2.72 SC-2 0.27 0.73 3.17 0.01 0.02 −27.8 443 2.23 SC-3 0.58 1.41 2.14 0.96 2.85 −28.22 439 2.80 SC-4 1.91 1.98 1.52 0.03 0.05 −27.74 582 2.86 SC-5 0.38 0.79 1.32 0.08 0.03 −27.85 309 2.40 SC-6 2 2.3 1.8 0.16 0.11 −28.34 301 2.42 注:TOC—有机碳含量;TC—总碳含量;TS—总硫含量;S1—游离烃量;S2—热解烃量;δ13CTOC—有机碳同位素;Tmax—岩石热解最高峰温度;Ro—镜质体反射率 3.1.2 残留有机质丰度
烃源岩中的有机质是生烃的物质基础,有机质丰度是决定烃源岩生烃潜力的重要指标(赵青芳等, 2023)。TOC和PG(S1+S2)是表征有机物丰度的常用指标(Tissot et al., 1984)。由于本次烃源岩样品属于过成熟烃源岩,处于热演化后期阶段,已经进行了大量排烃,PG数值很小,分布范围为0.02~8.34 mg/g,平均值仅为0.73 mg/g(N=39),表明针对高熟—过熟烃源岩,PG参数的适用性不好,难以准确、客观地评价烃源岩的生烃能力。因此残留TOC(简称TOC)可能是评价高熟—过熟烃源岩有机质丰度的唯一指标,但是生烃过程中存在大量的有机质消耗,因此也有必要开展原始有机质丰度恢复。
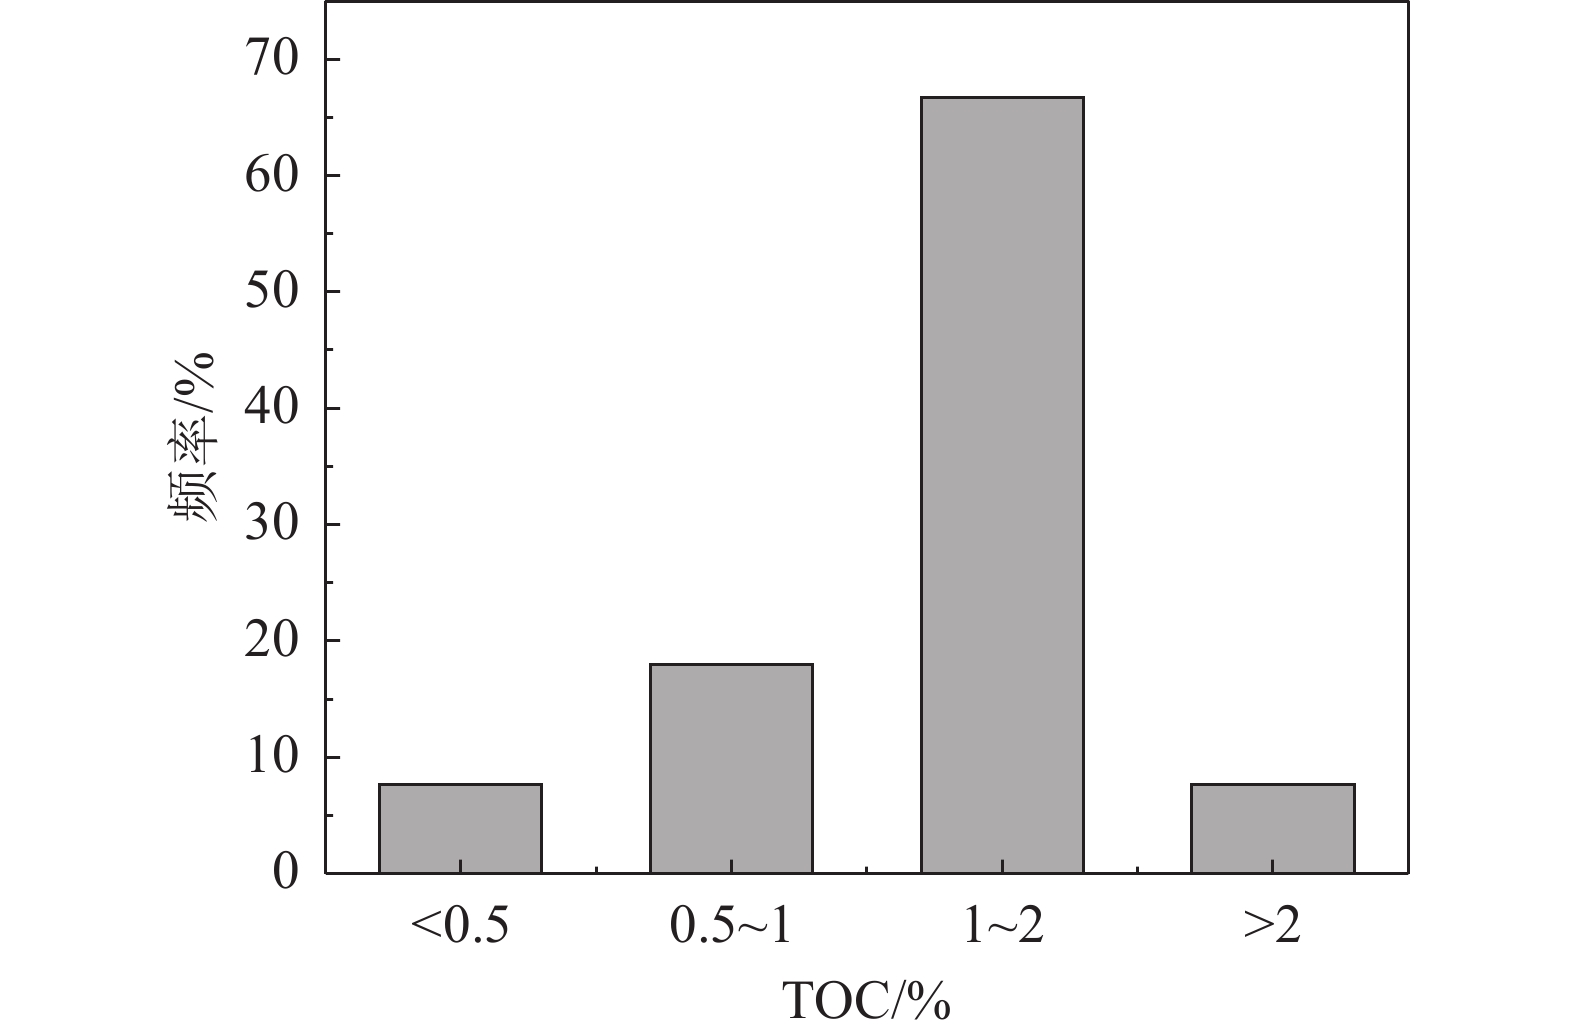
烃源岩样品中TOC含量范围为0.27%~2.61%,平均值为1.28%(N=39)(表1)。其中,TOC < 0.5%,0.5%≤TOC<1%,1%≤TOC<2%,TOC≥2%的样品分别占7.69%、17.95%、66.67%和7.69%(图3)。从残余有机质丰度的角度来说,四深1井区烃源岩仍属于中等—好烃源岩,具有足够的生烃基础。
3.1.3 有机质类型
有机质类型是决定烃源岩生烃能力的重要参数,不同类型的有机质具有不同的生烃潜力(Li et al., 2021)。岩石热解相关参数氢指数(HI)、氧指数(OI)、Tmax及干酪根显微组分、有机元素和干酪根碳同位素是判断有机质类型的常用参数(Hunt, 1979)。然而,由于过成熟烃源岩的HI值极低,利用相关热解参数判别图版难以有效确定烃源岩样品的有机质类型(Hakimi et al., 2014)。但通过有机显微组分及有机碳同位素判别有机质类型的方法依然适用(Wang et al., 2021)。
当有机显微组分指数(TI)大于80时,为Ⅰ型干酪根;若TI介于80~40之间,为Ⅱ1型干酪根;若TI介于40~0之间,为Ⅱ2型干酪根;若TI小于0,为Ⅲ型干酪根(曹庆英, 1985) 。四深1井区上古生界烃源岩样品的TI值范围为98~187.75(N=5),平均值为122.9,全部大于80,表明研究区烃源岩的有机质类型整体为Ⅰ型干酪根。
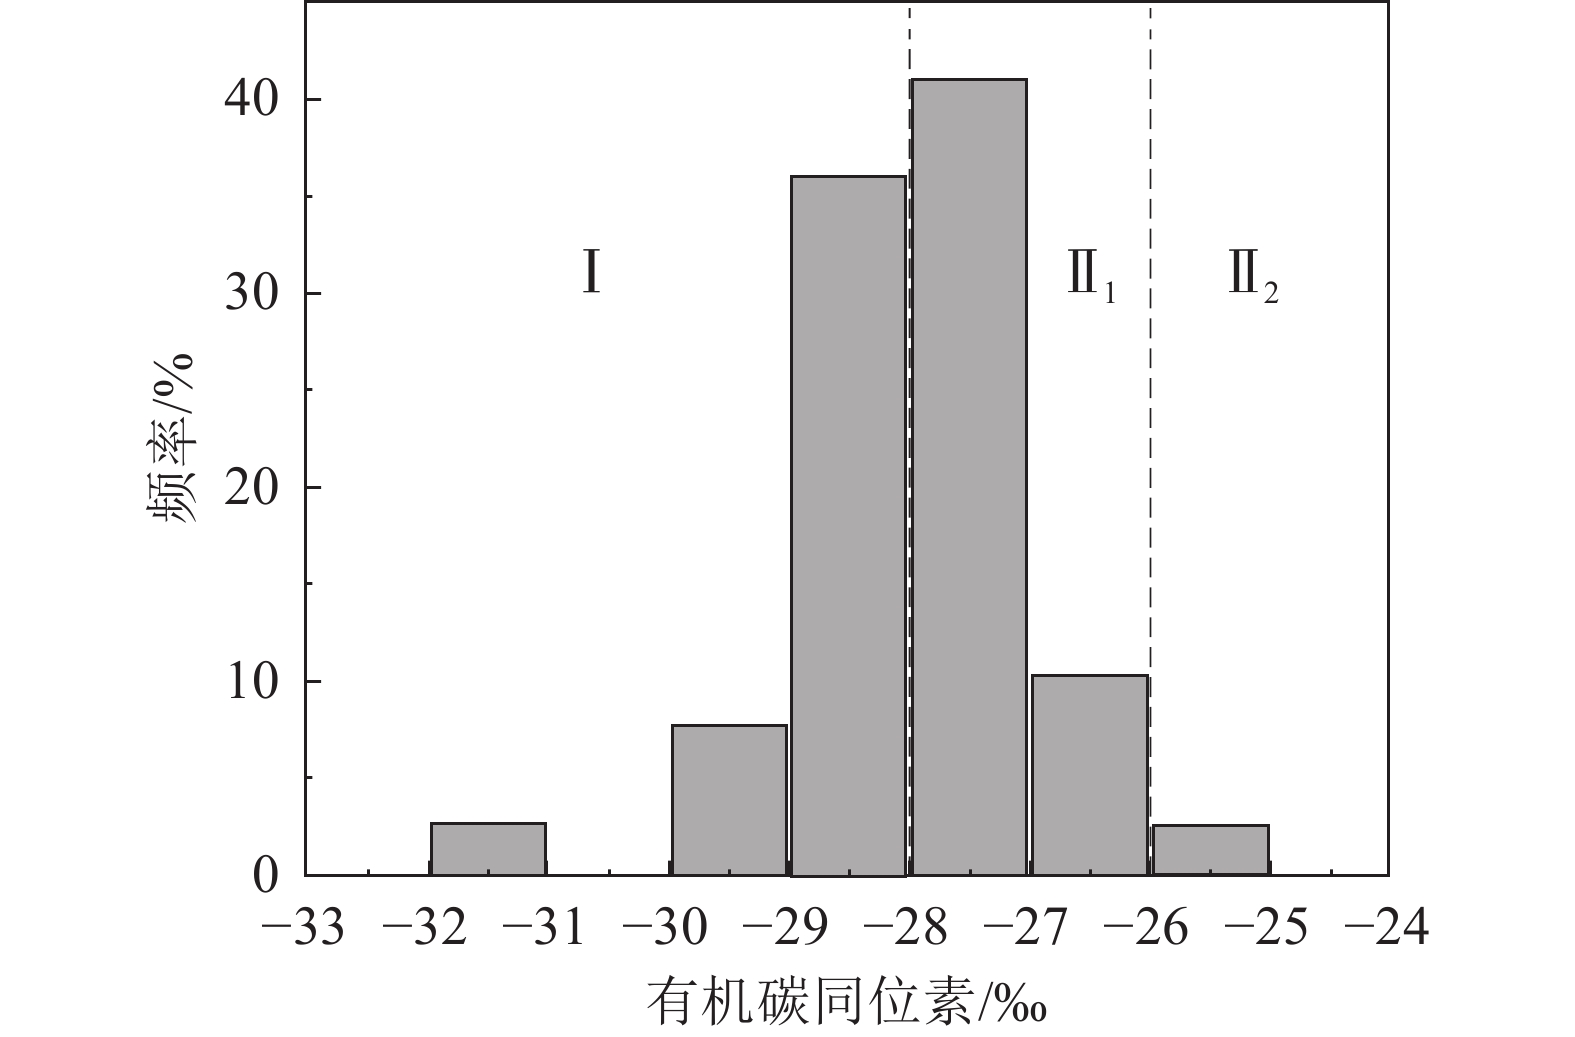
干酪根碳同位素是确定高熟—过成熟烃源岩有机质类型的有效参数(Hu et al., 2016)。因为干酪根碳同位素在热演化过程中变化不大,一般变重1‰~2‰,最大不超过3‰,所以能反映原始有机质生源构成和类型。一般以陆源高等植物为主要有机质生源的生油岩干酪根碳同位素较重,而水生生物贡献较大的沉积有机质中碳同位素较轻。通常Ⅰ型干酪根 δ13CTOC值分布范围为−27‰~−33‰,Ⅱ型干酪根的δ13CTOC为−26‰~−27‰,Ⅲ型干酪根δ13CTOC介于−22.5‰~−26‰之间(黄第藩等, 1984)。根据δ13CTOC值分布范围可以得知,四深1井区烃源岩样品的有机质类型中有46.15%为Ⅰ型,51.28%为Ⅱ1型,Ⅱ2型仅为2.56%,没有Ⅲ型有机质(图4)。总体来说,四深1井区烃源岩中有机质类型应以Ⅰ和Ⅱ1型为主。
3.2 烃源岩原始品质特征恢复
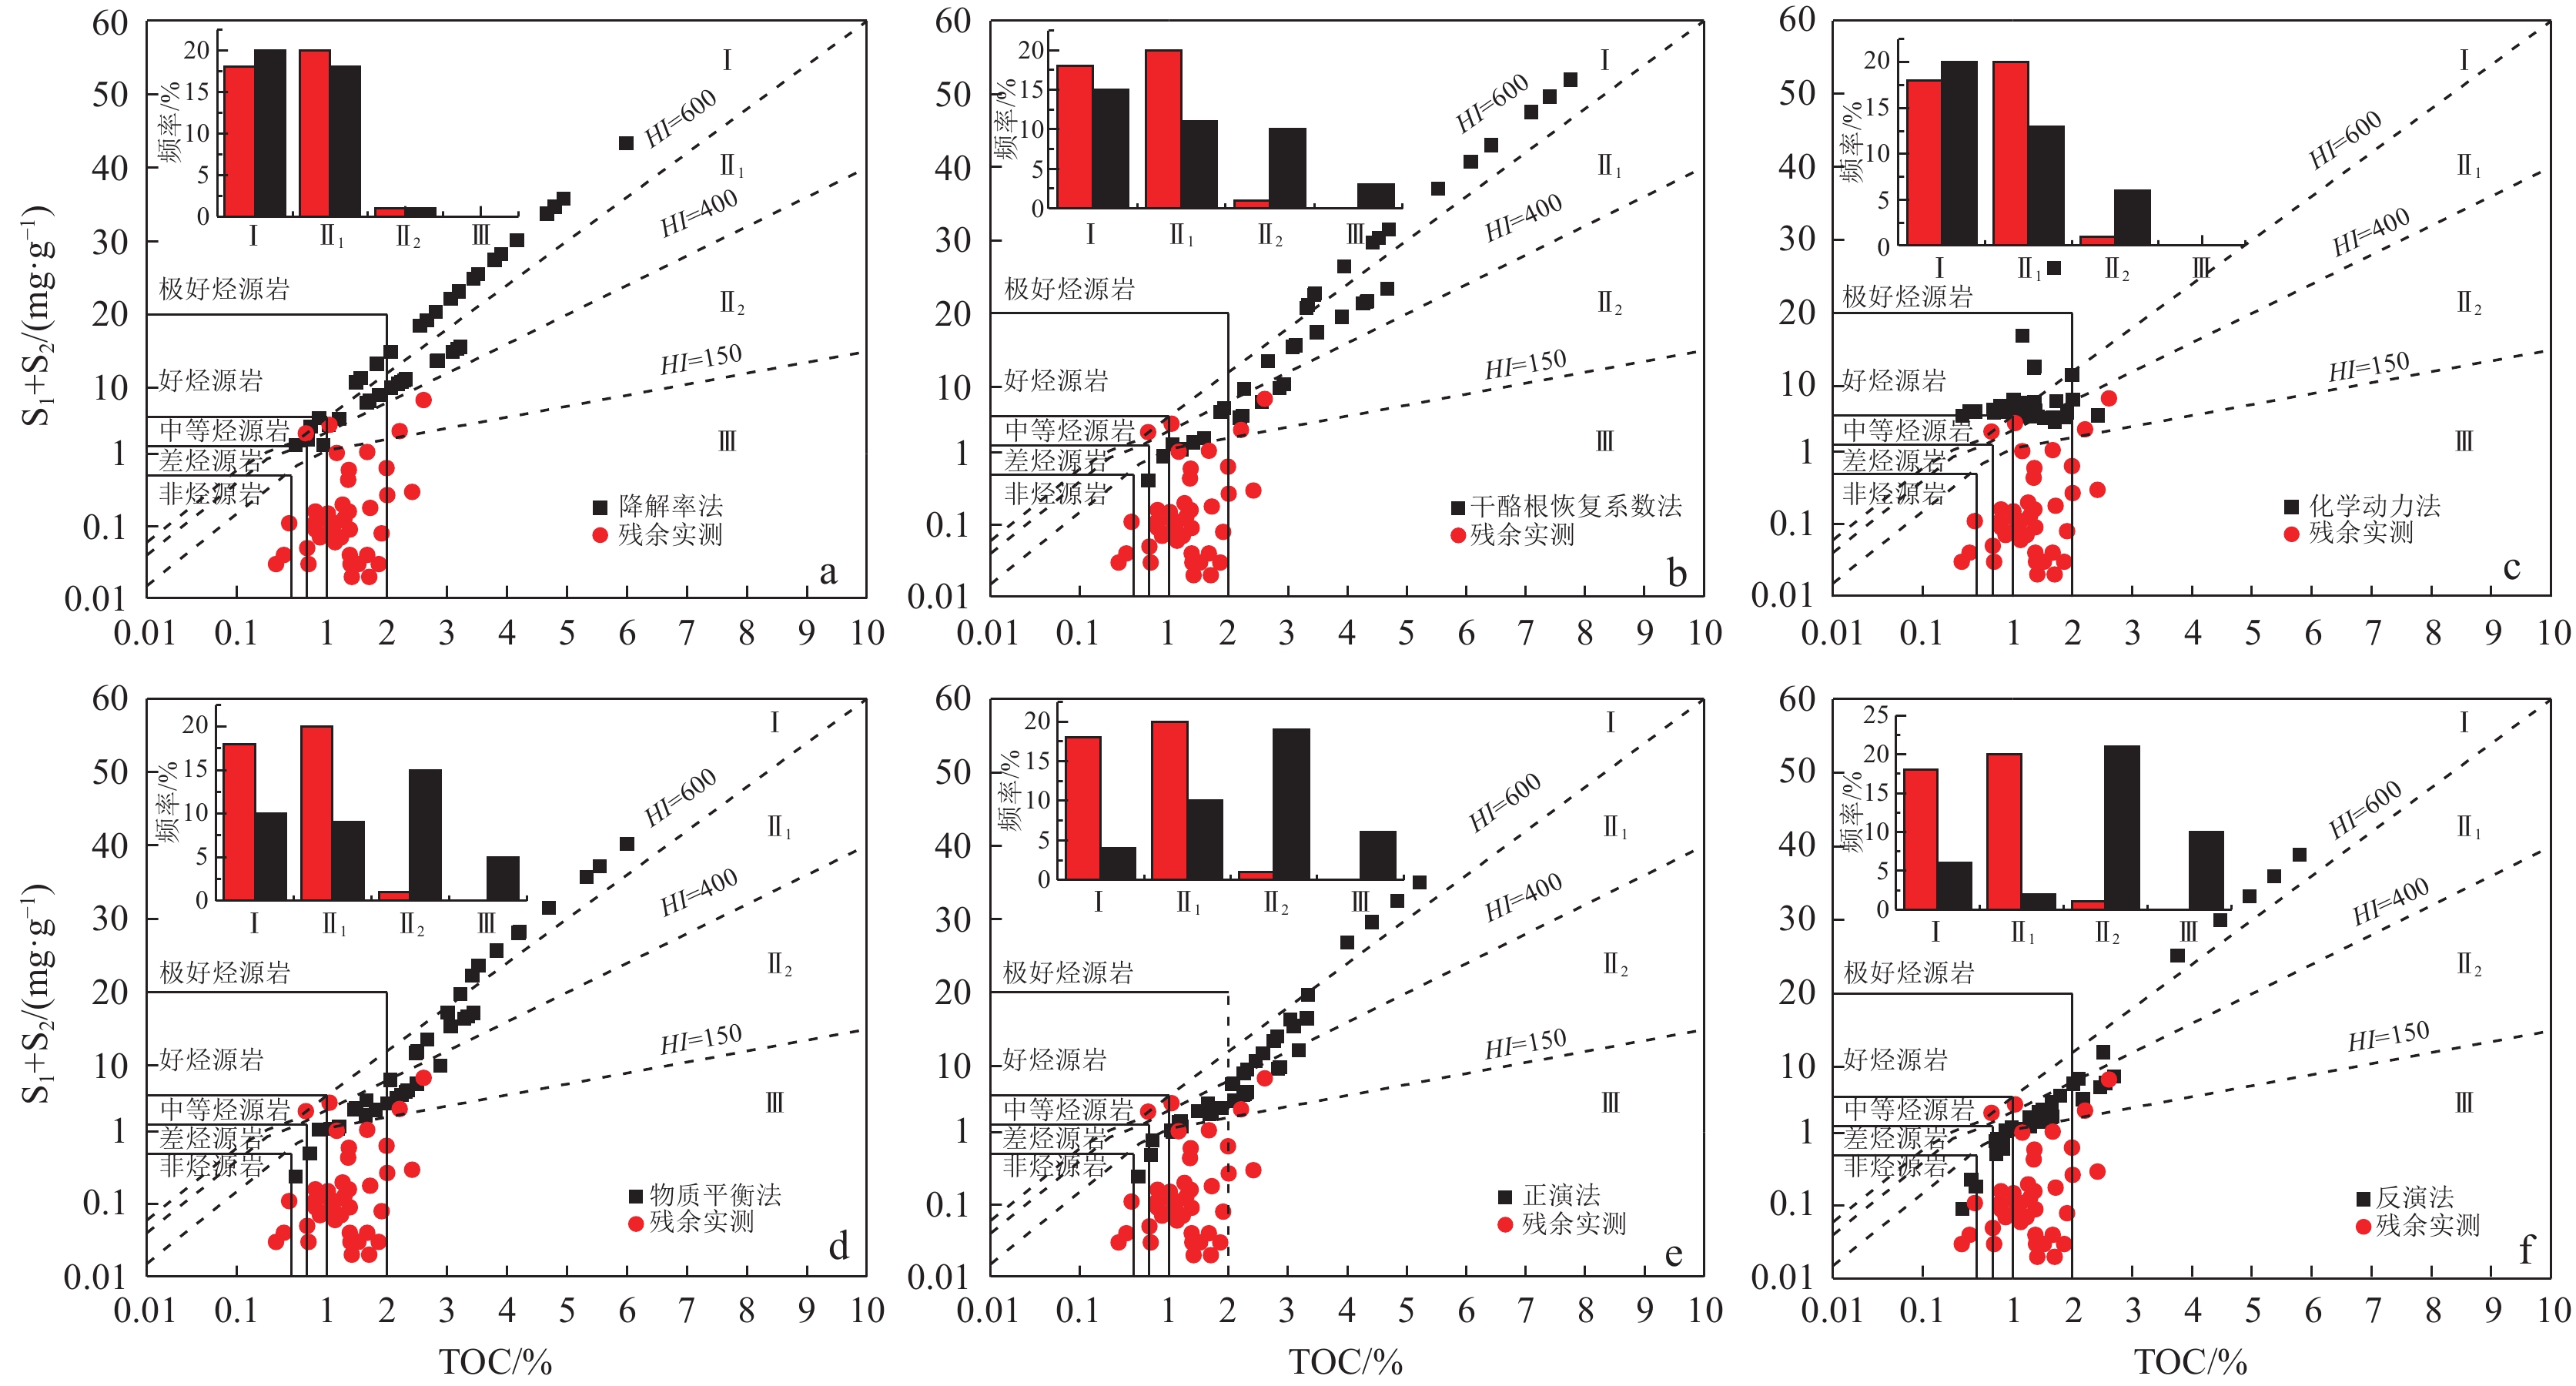
基于上述不同方法恢复后,烃源岩的TOC和S2含量均有不同程度的提高(表2;图5),化学动力法恢复的TOC含量在0.27%~2.66%,平均值为1.29%,TOC恢复系数平均值为1.01,恢复后S2含量为5.16~104.07 mg/g,平均值为13.89 mg/g;反演法恢复的TOC含量在0.27%~5.80%,平均值为1.93%,TOC恢复系数平均值为1.38,恢复后S2含量为0.09~38.88 mg/g,平均值为7.91;正演法恢复的TOC含量为0.45%~5.22%,平均值为2.36%,TOC恢复系数平均值为1.83,恢复后S2含量为0.24~34.97 mg/g,平均值为10.09 mg/g;物质平衡法恢复的TOC含量介于0.45%~6.00%之间,平均值为2.68%,TOC恢复系数平均值为2.07,恢复后S2含量为0.24~40.22 mg/g,平均值为13.14 mg/g;降解率法恢复的TOC含量在0.45%~5.99%之间,平均值为2.56%,TOC恢复系数平均值为1.97,恢复后S2含量为2.15~43.28 mg/g,平均值为16.11 mg/g;干酪根恢复系数法恢复的TOC含量在0.59%~7.75%之间,平均值为3.59%,TOC恢复系数平均值高达2.76,恢复后S2含量为0.41~51.94 mg/g,平均值为19.85 mg/g。
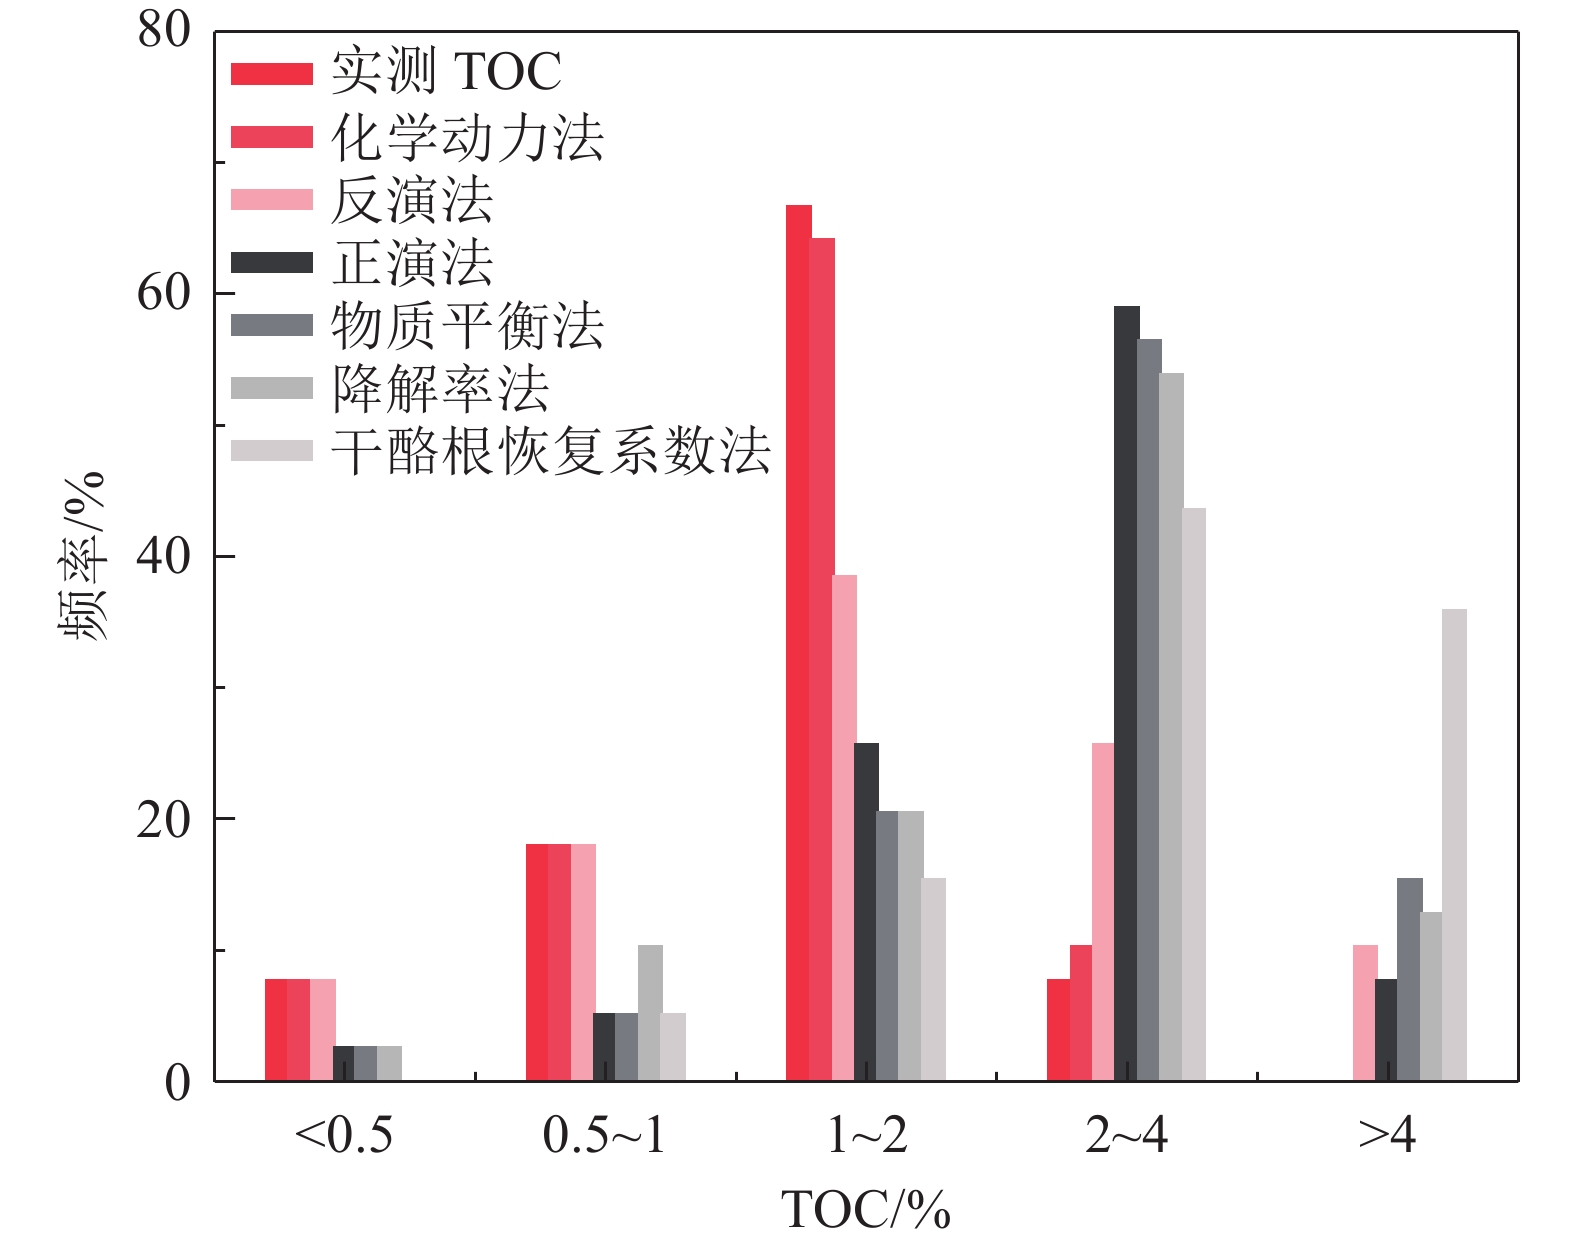
表 2 不同方法恢复后TOC相关参数变化Table 2. Changes in TOC-related parameters after recovery by different methods恢复方法 化学动力法 反演法 正演法 物质平衡法 降解率法 干酪根恢复系数法 恢复TOC范围/% 0.27~2.66 0.27~5.80 0.45~5.22 0.45~6.00 0.45~5.99 0.59~7.75 恢复TOC平均值/% 1.29 1.93 2.36 2.68 2.56 3.59 平均TOC恢复系数 1.01 1.38 1.83 2.07 1.97 2.76 恢复S2范围/(mg·g−1) 5.16~104.07 0.09~38.88 0.24~34.97 0.24~40.22 2.15~43.28 0.41~51.94 恢复S2平均值/(mg·g−1) 13.89 7.91 10.09 13.14 16.11 19.85 可以看出干酪根恢复系数法恢复后的原始S2平均值最大,而反演法恢复的原始S2平均值最小。使用干酪根恢复系数法的平均TOC恢复系数最高,恢复出来的原始有机质丰度最高,化学动力法恢复的结果平均TOC恢复系数最低,恢复的原始TOC几乎无变化。降解率法、物质平衡法及正演法的TOC恢复结果较接近,恢复的原始TOC平均值都接近2.5%。化学动力法和反演法恢复的原始TOC主要集中在1%~2%,而其他4种方法恢复的原始TOC主要分布在2%~4%。但总体来说,所有恢复方法结果均显示,松辽盆地四深1井区古生界原始烃源岩为中等—极好烃源岩(图6)。
4. 讨 论
4.1 恢复方法优选及原始烃源岩特征评价
上述恢复结果显示,不同方法之间恢复的数值存在较大差异,说明并不是所有的方法均适用该研究区,需对恢复方法进行优选。基于运用有机显微组分和有机碳同位素划分的有机质类型较为可靠,且基本不受成熟度的影响,因此可用恢复后的(S1+S2)-TOC图版判断有机质类型,与利用有机碳同位素划分的有机质类型进行对比,统计有机质类型相同的样品个数与总样品数相比作为吻合率,将有机质类型吻合率最高的方法作为优选。需要指出的是,由于恢复到初始未成熟—低成熟阶段,烃源岩的S1含量非常低,可以忽略不计,可以用S2代替Pg(S1+S2)(Li et al., 2020)。各方法中使用降解率法恢复的有机质类型与使用有机碳同位素划分的有机质类型吻合率最高,可达95%;其次是化学动力法,吻合率为82%;干酪根恢复系数法吻合率为69%;物质平衡法、正演法、反演法恢复后的吻合率分别为51%、38%、23%(图6),对比结果表明,物质平衡法、正演法、反演法3种方法不适用于研究区的高—过成熟烃源岩,而干酪根恢复系数法、化学动力法跟降解率法恢复结果较好,对该地区烃源岩恢复适用度高,其中降解率法恢复的有机质类型吻合率达95%,可作为适合研究区原始烃源岩品质特征恢复的最佳方法。
通过降解率法恢复的原始有机质丰度和原始S2开展原始烃源岩特征评价,可以看出恢复后的烃源岩有机质类型主要集中在Ⅰ型和Ⅱ1型,原始有机质丰度可以达到好—极好级别(图6),综合评价为好—极好烃源岩。
4.2 热演化过程中排烃量估算
已有专家和学者(赵志魁等, 2011;黄志龙等, 2013)对松辽盆地上古生界烃源岩的二次生烃量和资源量进行了初步估算,估算松辽盆地石炭系—二叠系的二次生油量为840×108 t,二次生气量为136.48×10¹² m3;石油资源量为42.07×10⁸ t,天然气资源量为6828×108 m3,表明松辽盆地基底具有巨大的油气资源潜力。但是没有针对四深1井区上古生界的排烃量开展研究,本次基于恢复的烃源岩原始特征参数,采用生烃潜力法,对松辽盆地四深1井区上古生界烃源岩热演化过程中的排烃量进行估算。
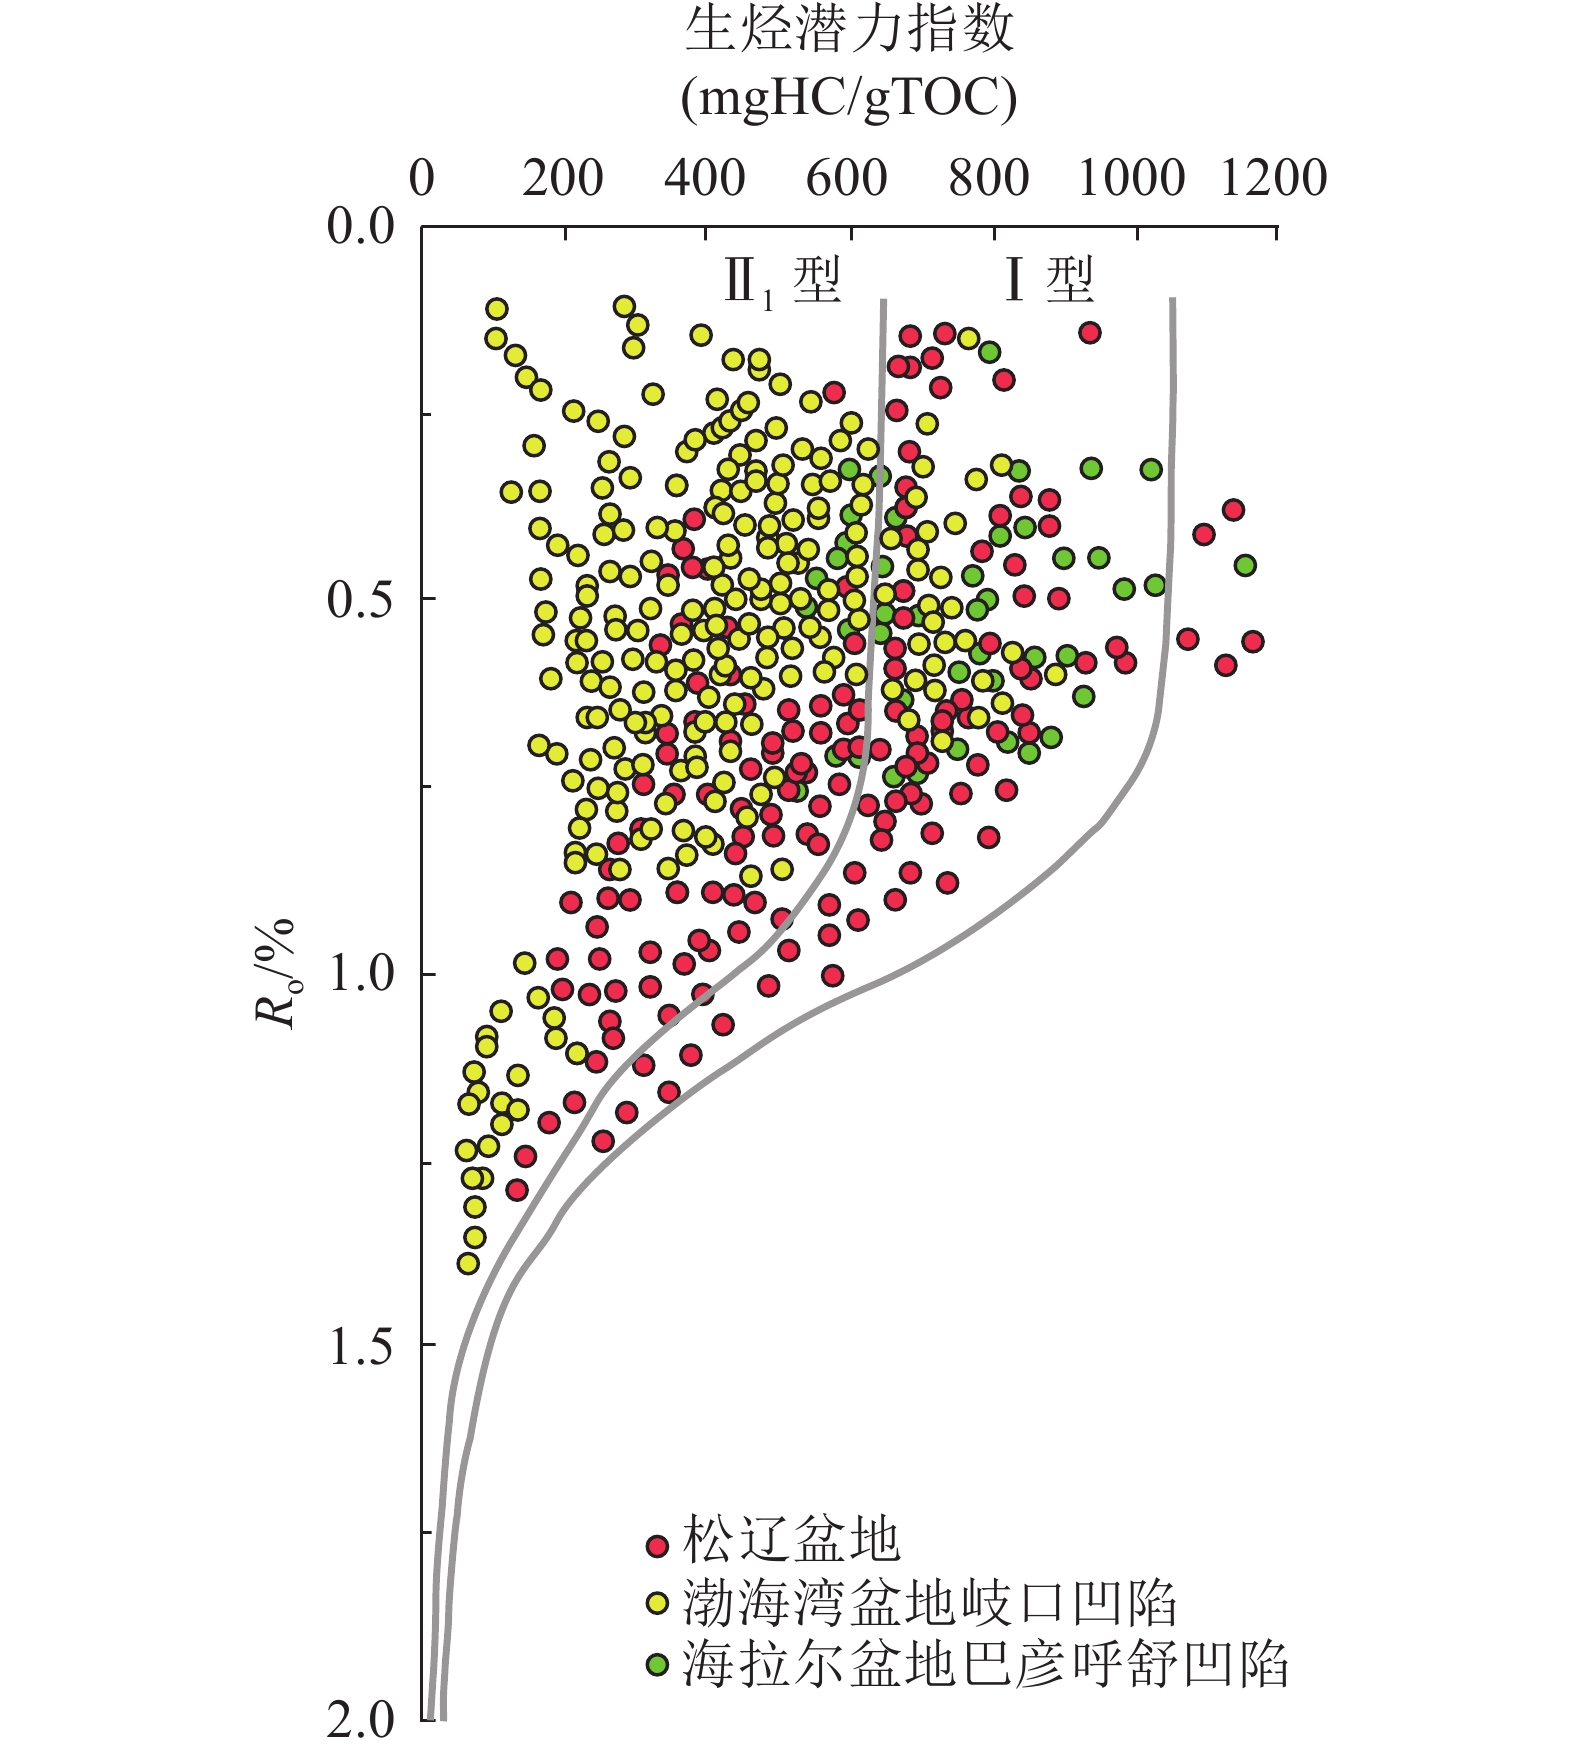
生烃潜力法依据物质守恒原理,将同一烃源岩层不同热演化程度下的样品看成是同一采样点烃源岩不同时期的转化产物,可以通过收集不同成熟度的样品建立完整的烃源岩热演化剖面,再根据演化剖面中生烃潜力指数((S1+S2)/TOC)的变化研究烃源岩层的生、排烃特征(马中振等, 2009)。虽然四深1井区上古生界缺乏未熟、低熟烃源岩的热解数据,但相关研究认为,不同类型盆地同一类型的干酪根生烃转化率基本相同(Niu et al., 2023),并建立了不同类型有机质的生排烃模型(图7)(陈建平等, 2014),可将Ⅰ型和Ⅱ1型有机质生烃模式应用于四深1井区未成熟—过成熟的热演化过程中烃源岩生排烃研究,并计算其排烃量。
![]() 图 7 不同盆地烃源岩生烃排烃模式图(据陈建平等,2014)Figure 7. Hydrocarbon generation and drainage patterns of hydrocarbon source rocks in different basins
图 7 不同盆地烃源岩生烃排烃模式图(据陈建平等,2014)Figure 7. Hydrocarbon generation and drainage patterns of hydrocarbon source rocks in different basins研究区高熟—过熟烃源岩通过恢复后的Ⅰ型有机质烃源岩原始TOC平均值为3.10%,Ⅱ1型有机质烃源岩原始TOC平均值为2.06%,可用恢复后的原始TOC平均值代替对应有机质类型烃源岩的原始TOC。
一般来说,对于没有进入生烃阶段的未成熟源岩,GPIo和HIo是相同的(Li et al., 2020),研究区Ⅰ型有机质恢复后的原始HI平均值为722.89 mg/g,Ⅱ1型有机质恢复后的原始HI平均值为481.93 mg/g,因此可以用恢复后的原始HI代替原始GPI。根据TOCo及GPIo参数,结合生排烃模型及相关公式,可以得出四深1井区上古生界烃源岩的热演化过程中排烃率、排烃速率等参数的变化(表3、表4)。
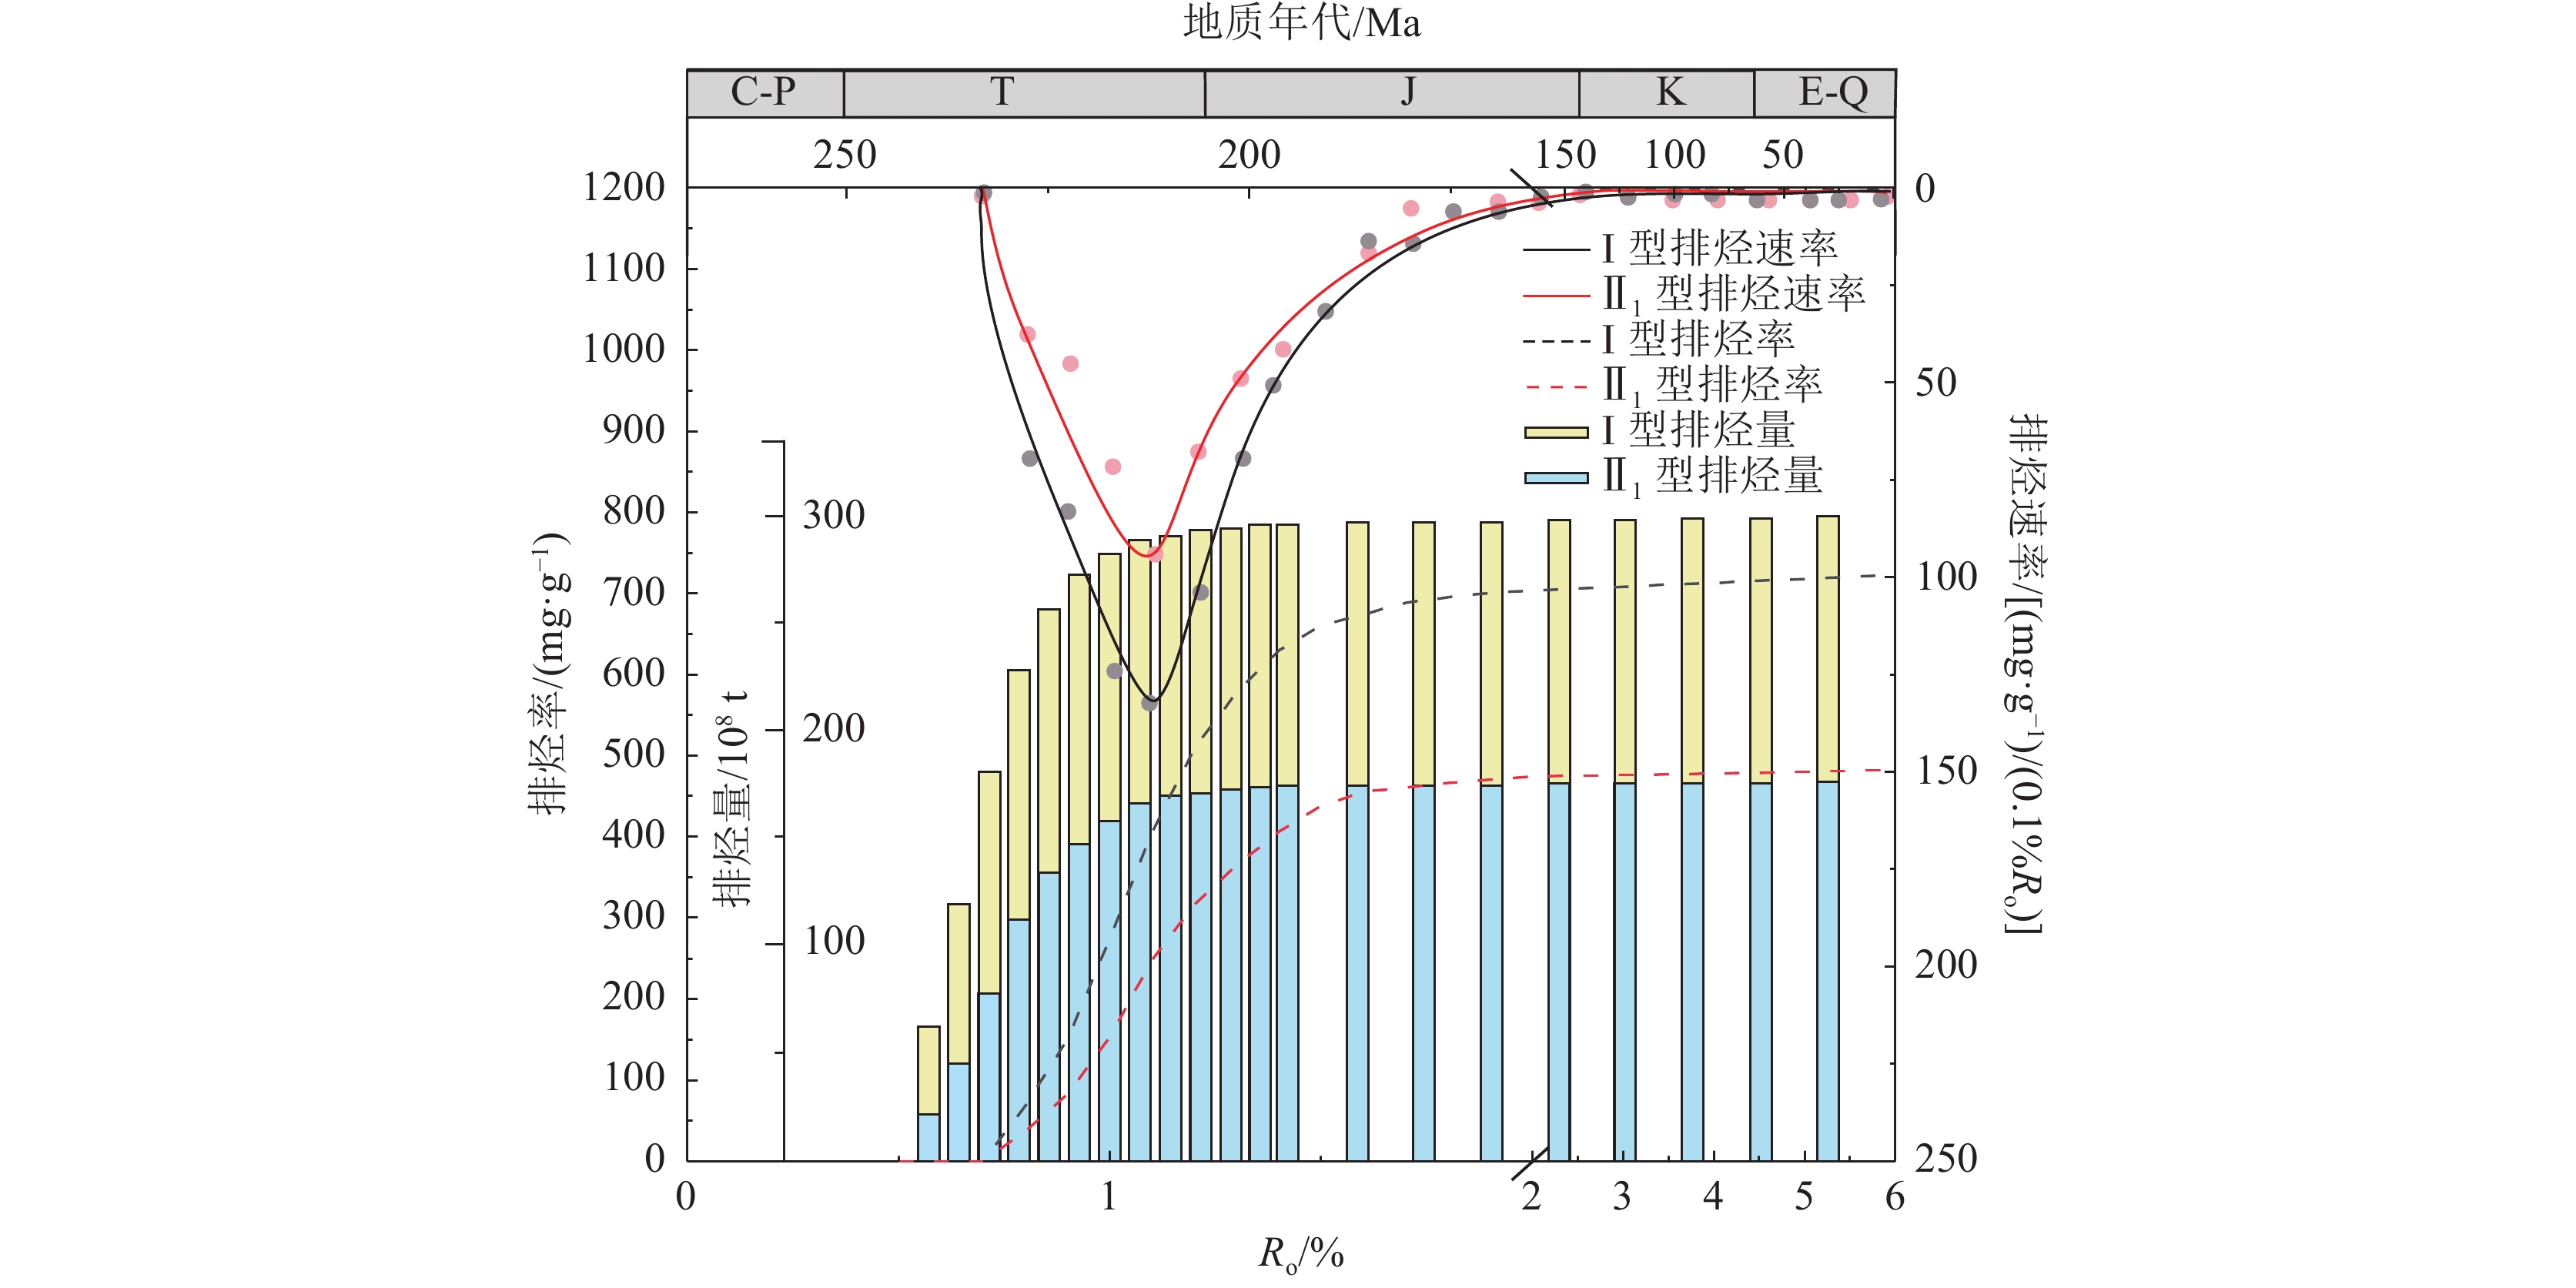
表 3 Ⅰ型有机质烃源岩排烃过程各参数变化Table 3. Variation of parameters in the process of hydrocarbon removal from type Ⅰ organic hydrocarbon source rock成烃期 Ro/% 生烃转化率/% GPI/(mg·g−1) 排烃率/(mg·g−1) 排烃速率/[(mg·g−1)/(0.1%Ro)] TOC/% 排烃强度/(104t/km2) 排烃量/(108 t) 未熟期 0.50 0.00 722.89 0.00 0.00 3.10 0 0 0.60 0.00 722.89 0.00 0.00 3.10 0 0 主要成油期 0.70 0.00 722.89 0.00 0.00 3.10 0 0 0.80 9.52 654.04 68.85 68.85 2.71 203.64 61.835 0.90 20.95 571.43 151.46 82.62 2.36 389.57 118.293 1.00 38.10 447.50 275.39 123.92 1.97 592.40 179.884 1.10 56.19 316.69 406.20 130.81 1.68 745.09 226.250 1.20 70.48 213.42 509.47 103.27 1.51 837.18 254.212 1.30 80.00 144.58 578.31 68.85 1.41 888.60 269.827 主要成气期 1.40 87.14 92.94 629.95 51.64 1.34 922.99 280.269 1.50 91.43 61.96 660.93 30.98 1.31 942.13 286.081 1.60 93.33 48.19 674.70 13.77 1.29 950.31 288.565 1.70 95.24 34.42 688.47 13.77 1.27 958.29 290.990 1.80 96.19 27.54 695.35 6.88 1.27 962.22 292.181 1.90 96.95 22.03 700.86 5.51 1.26 965.32 293.124 2.00 97.33 19.28 703.61 2.75 1.26 966.86 293.592 过熟期 2.50 97.67 16.87 706.02 0.48 1.26 968.21 294.000 3.00 98.00 14.46 708.43 0.48 1.25 969.54 294.406 3.50 98.33 12.05 710.84 0.48 1.25 970.88 294.811 4.00 98.67 9.64 713.25 0.48 1.25 972.20 295.214 4.50 99.00 7.23 715.66 0.48 1.25 973.53 295.615 5.00 99.33 4.82 718.07 0.48 1.24 974.84 296.015 5.50 99.67 2.41 720.48 0.48 1.24 976.15 296.413 6.00 100.00 0.00 722.89 0.48 1.24 977.46 296.809 表 4 Ⅱ1型有机质烃源岩排烃过程各参数变化Table 4. Variation of parameters in the hydrocarbon drainage process of type Ⅱ1 organic hydrocarbon source rock成烃期 Ro/% 生烃转化率/% GPI/(mg·g−1) 排烃率/(mg·g−1) 排烃速率/[(mg·g−1)/(0.1%Ro)] TOC/% 排烃强度/(104t/km2) 排烃量/(108 t) 未熟期 0.50 0.00 481.93 0.00 0.00 2.06 0.00 0 0.60 0.00 481.93 0.00 0.00 2.06 0.00 0 主要成油期 0.70 0.00 481.93 0.00 0.00 2.06 0.00 0 0.80 0.08 444.28 37.65 37.65 1.95 71.21 21.622 0.90 0.17 399.10 82.83 45.18 1.84 147.87 44.901 1.00 0.32 327.56 154.37 71.54 1.69 253.10 76.856 1.10 0.52 233.43 248.49 94.13 1.53 367.96 111.731 1.20 0.66 165.66 316.27 67.77 1.43 437.77 132.929 1.30 0.76 116.72 365.21 48.95 1.37 482.78 146.597 主要成气期 1.40 0.84 75.30 406.63 41.42 1.32 517.81 157.236 1.50 0.91 43.67 438.25 31.63 1.28 542.89 164.850 1.60 0.95 26.36 455.57 17.32 1.26 556.05 168.846 1.70 0.96 21.08 460.84 5.27 1.25 559.98 170.039 1.80 0.97 15.06 466.87 6.02 1.25 564.42 171.390 1.90 0.98 11.30 470.63 3.77 1.24 567.18 172.227 2.00 0.98 7.53 474.40 3.77 1.24 569.92 173.059 过熟期 2.50 0.99 6.59 475.34 0.19 1.24 570.60 173.266 3.00 0.99 5.65 476.28 0.19 1.24 571.28 173.473 3.50 0.99 4.71 477.22 0.19 1.24 571.96 173.679 4.00 0.99 3.77 478.16 0.19 1.24 572.64 173.885 4.50 0.99 2.82 479.10 0.19 1.24 573.32 174.091 5.00 1.00 1.88 480.05 0.19 1.23 574.00 174.297 5.50 1.00 0.94 480.99 0.19 1.23 574.67 174.502 6.00 1.00 0.00 481.93 0.19 1.23 575.35 174.707 上古生界烃源岩在整个四深1井区都有分布,其中朝深1井烃源岩厚度600 m,四深1井烃源岩厚度为850 m,尚深2井烃源岩厚度为840 m,本次运用3口井烃源岩的平均厚度773 m作为厚度参数,研究区烃源岩整体密度为2.7 g/cm3(黄志龙等, 2013),按照恢复后有机质类型的含量占比,对Ⅰ型和Ⅱ1型有机质烃源岩厚度进行加权计算,并结合研究区面积及生排烃过程中相关参数的变化,计算出四深1井区上古生界烃源岩的热演化过程中排烃强度和排烃量(图8)。
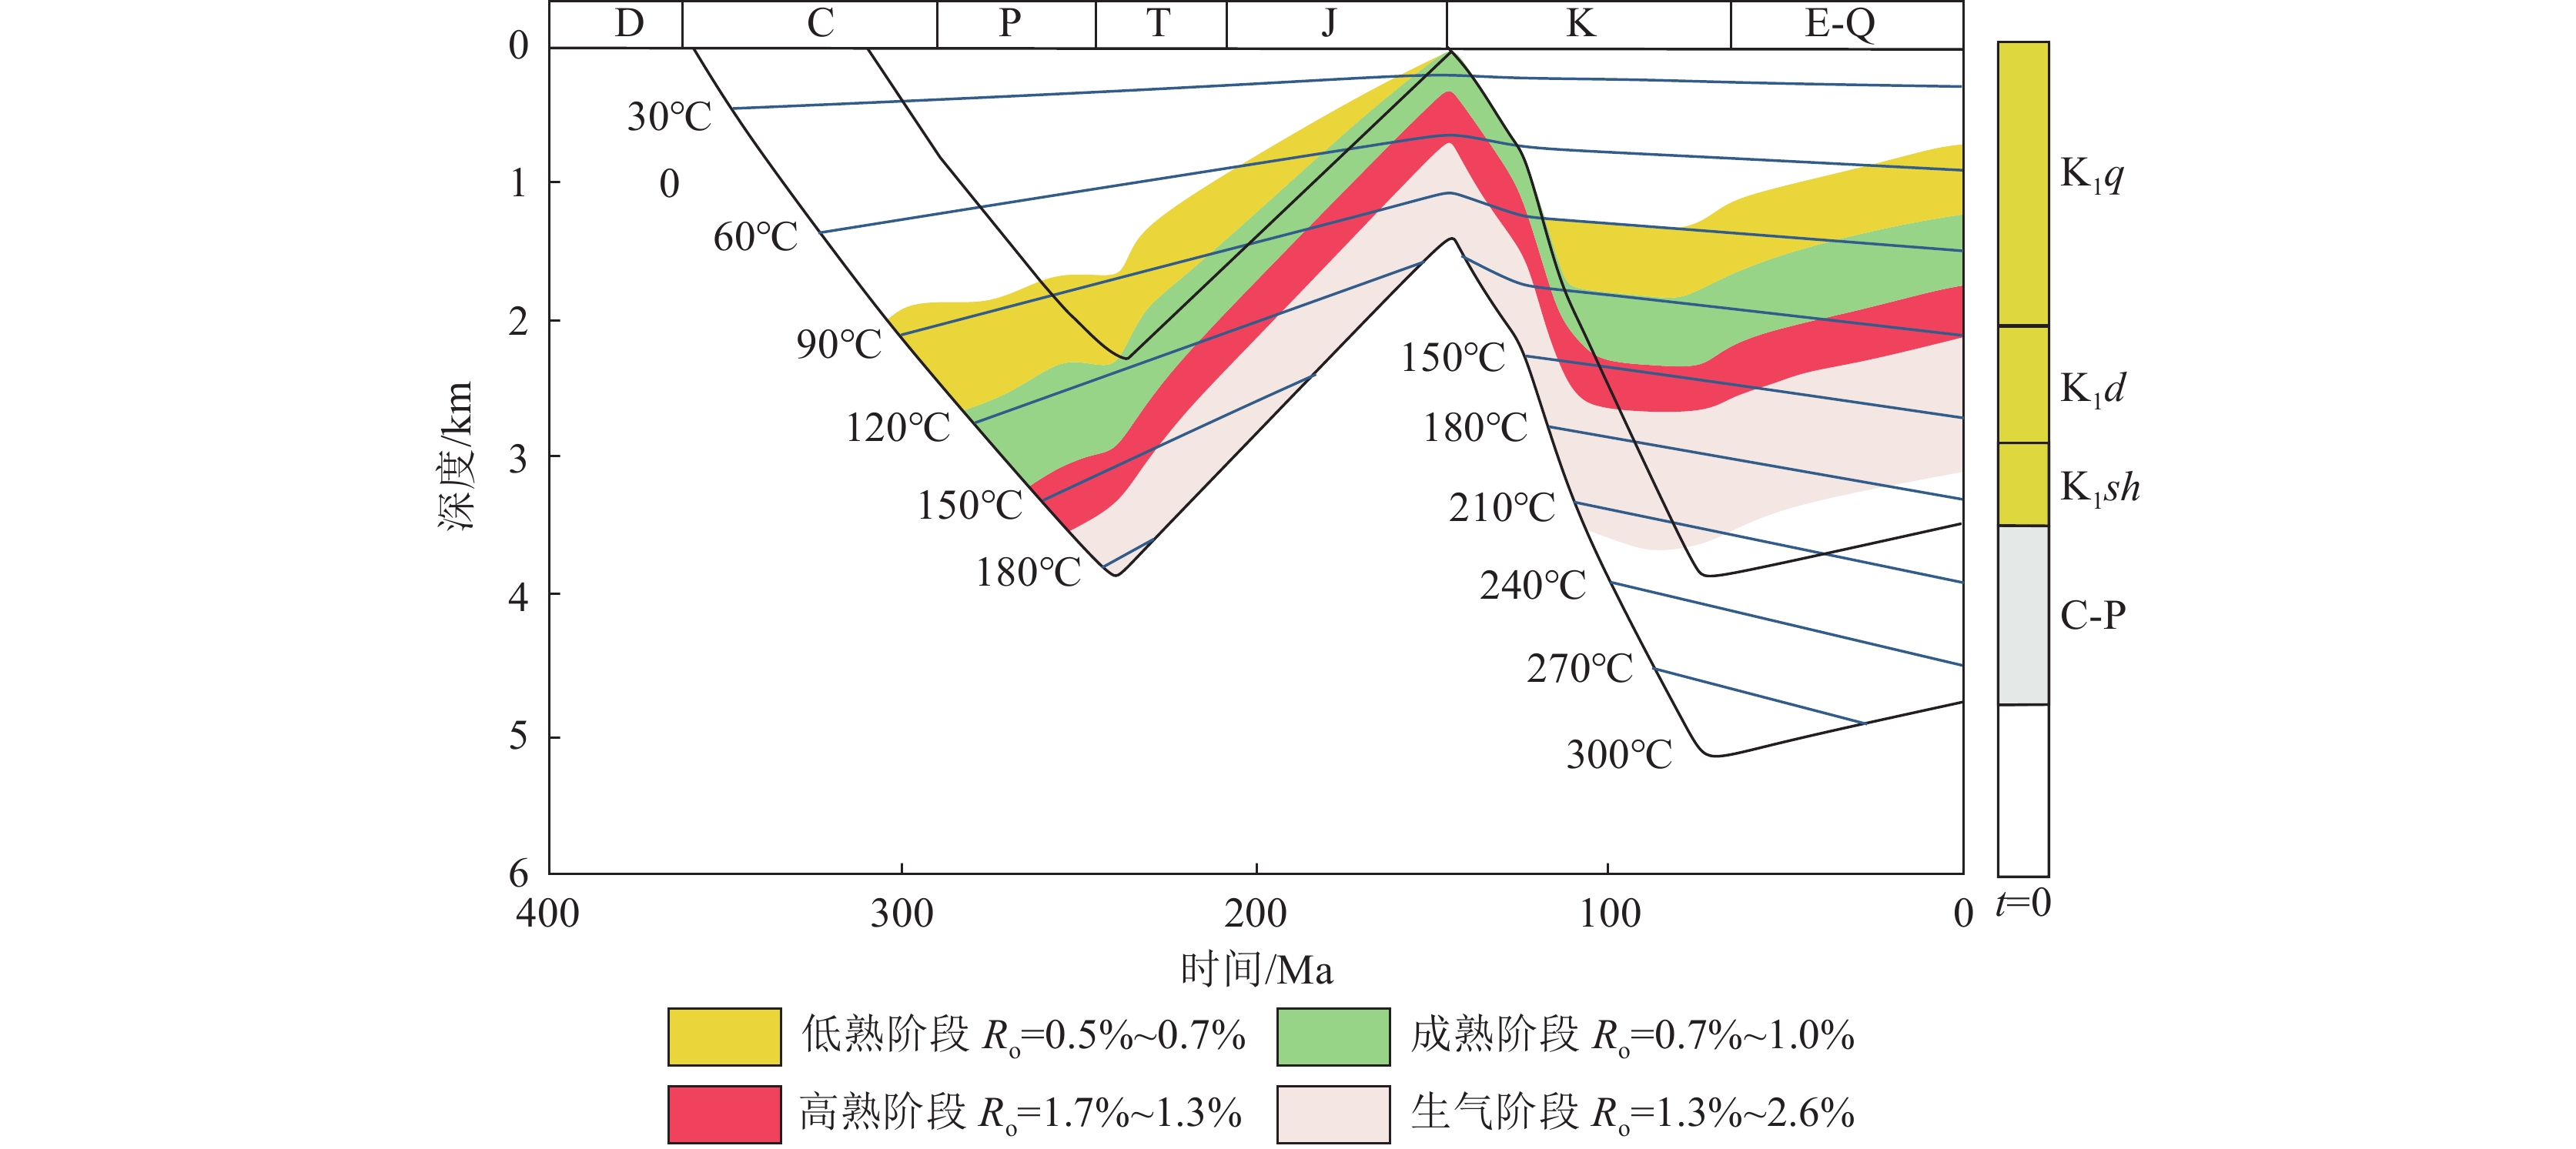
![]() 图 9 四深1井埋藏史图(据逯晓喻等,2013)K1q—泉头组;K1d—登娄库组;K1sh—沙河子组;D—泥盆纪;C—石炭纪;P—二叠纪;T—三叠纪;J—侏罗纪;K—白垩纪;E−Q—新近纪−第四纪Figure 9. The burial history of the Sishen 1 well
图 9 四深1井埋藏史图(据逯晓喻等,2013)K1q—泉头组;K1d—登娄库组;K1sh—沙河子组;D—泥盆纪;C—石炭纪;P—二叠纪;T—三叠纪;J—侏罗纪;K—白垩纪;E−Q—新近纪−第四纪Figure 9. The burial history of the Sishen 1 well根据计算结果,结合前人的热史模拟结果可知(图9)(任战利等, 2011),四深1井区上古生界Ⅰ型有机质烃源岩和Ⅱ1型有机质烃源岩总体在三叠纪早期(约230 Ma)进入排烃门限,排烃门限Ro为0.7%,此后三叠纪—侏罗纪早期(230~200 Ma)进入大量排烃阶段,Ro处于0.7%~1.3%之间,该阶段是研究区烃源岩的主要成油期,并在三叠纪晚期(约210 Ma)到达排烃高峰,Ro为1.1%,此时排烃速率最大,Ⅰ型有机质烃源岩排烃速率为130.81(mg·g−1)/(0.1%Ro),排烃强度为745.09×104 /km2;Ⅱ1型有机质烃源岩排烃速率为94.13(mg·g−1)/(0.1%Ro),排烃强度为367.96×104/km2。生油阶段的排烃量为416.423×108 t。之后到侏罗纪中晚期阶段(200~165 Ma),烃源岩大部分处于高成熟阶段,该阶段是研究区烃源岩的主要成气期,Ro处于1.3%~2.0%之间,生气量为55.093×10⁸ t。侏罗纪晚期之后大部分烃源岩处于过成熟阶段,Ro > 2.0%,进入排烃末期,排烃缓慢,趋于平稳。总体来说,目前四深1井区上古生界烃源岩处于过熟阶段,现今累计排烃量达471.516×10⁸ t,其中Ⅰ型有机质烃源岩排烃量达296.809×10⁸ t,Ⅱ1有机质烃源岩排烃量达174.707×10⁸ t。在构造相对稳定的区域应该具有天然气藏。
5. 结 论
本文对松辽盆地四深1井区上古生界高—过成熟烃源岩进行了原始有机质特征恢复和评价,并估算热演化过程中烃源岩的排烃量,得出结论如下。
(1)松辽盆地四深1井区烃源岩目前处于过成熟热演化阶段,有机质类型以Ⅰ型、Ⅱ1型为主。优选降解率法为开展烃源岩原始品质特征恢复,原始TOC和S2平均值为2.56%和16.11 mg/g,综合评价为好—极好烃源岩。
(2)四深1井区上古生界烃源岩在三叠纪早期(约230 Ma)进入排烃门限(Ro=0.7%),原油成藏阶段为三叠纪—侏罗纪早期(230~200 Ma),排烃量高达416.423×10⁸ t;主要成气期在侏罗纪中晚期阶段(200~165 Ma),排烃量为55.093×10⁸ t。现今累计排烃量达471.516×10⁸ t,表明四深1井区上古生界烃源岩为油气成藏提供了丰富的烃源。
-
图 1 研究区基底骨架断裂分布图(a)及地层柱状图(b)(王成文等, 2009; 邢大全等, 2015)
Figure 1. Distribution of basal skeleton fractures (a) and stratigraphic histogram (b) of the study area
图 2 生排烃模式图(Pang et al., 2005)
Figure 2. Pattern diagram of hydrocarbon expulsion from source rocks
图 7 不同盆地烃源岩生烃排烃模式图(据陈建平等,2014)
Figure 7. Hydrocarbon generation and drainage patterns of hydrocarbon source rocks in different basins
图 9 四深1井埋藏史图(据逯晓喻等,2013)
K1q—泉头组;K1d—登娄库组;K1sh—沙河子组;D—泥盆纪;C—石炭纪;P—二叠纪;T—三叠纪;J—侏罗纪;K—白垩纪;E−Q—新近纪−第四纪
Figure 9. The burial history of the Sishen 1 well
表 1 样品实测地球化学参数
Table 1 Measured geochemical parameters of the samples
样品编号 TOC/% TC/% TS/% S1/(mg·g−1) S2/(mg·g−1) δ13CTOC/‰ Tmax/℃ Ro/% 4S-1 2.42 3.07 1.12 0.26 0.04 −28.05 409 2.13 4S-2 1.41 1.45 0.02 0.01 0.01 −29.66 350 2.79 4S-3 1.52 1.6 1.51 0.01 0.02 −30.15 433 2.90 4S-5 1.86 2.21 2.87 0.01 0.02 −27.11 340 2.87 4S-6 1.67 1.95 6.67 0.01 0.03 −28.18 429 2.92 4S-7 1.23 1.44 1.37 0.01 0.06 −28.95 439 2.55 4S-8 1.67 2.35 1.18 0.13 1.17 −29.2 434 2.88 4S-9 1.38 1.38 0.94 0.01 0.03 −28.97 440 2.63 4S-10 0.62 0.74 0.03 0.01 0.02 −27.52 434 2.44 4S-11 1.03 1.1 0.7 0.05 0.03 −27.91 469 2.13 4S-12 2.61 2.77 1.69 5.14 3.20 −28.08 427 2.2 4S-13 1.72 1.83 1.57 0.06 0.12 −27.74 425 2.27 4S-14 1.39 1.49 0.85 0.02 0.01 −27.33 278 2.79 4S-15 1.16 1.29 0.11 0.53 0.62 −28.41 372 2.20 4S-16 1.7 1.84 0.71 0.01 0.01 −27.64 412 2.96 4S-17 1.38 1.44 0.11 0.07 0.02 −27.92 277 2.45 4S-18 1.35 1.91 0.12 0.03 0.41 −27.67 435 2.12 4S-19 1.36 1.73 1.39 0.27 0.33 −27.82 379 2.52 4S-20 1.13 1.99 0.15 0.10 0.01 −27.71 269 2.68 4S-21 1.26 1.77 0.09 0.11 0.09 −27.87 327 2.70 4S-22 1.29 2 0.61 0.11 0.02 −29.29 277 2.84 4S-23 1.99 2.2 0.38 0.31 0.33 −26.98 395 2.2 4S-24 1.36 2.33 3.06 0.07 0.09 −26.74 410 2.6 C1-1 1.04 1.06 2.56 0.11 4.88 −30.01 428 2.5 C8-1 0.6 0.63 3.08 0.01 0.04 −29.6 344 2.67 C8-2 0.33 0.48 1.57 0.01 0.03 −32.23 447 2.68 C8-3 1.13 1.18 0.78 0.02 0.04 −28.92 436 2.1 C8-4 1.01 1.28 0.63 0.04 0.11 −26.76 374 2.68 C8-5 0.74 1.07 0.61 0.04 0.12 −25.83 415 2.03 C8-6 0.83 0.88 0.7 0.02 0.05 −28.29 440 2.67 C8-7 0.73 1.05 0.35 0.03 0.08 −27.64 397 2.32 C8-8 0.74 1.13 0.17 0.03 0.06 −28.5 311 2.17 C8-9 1.03 1.33 0.13 0.03 0.09 −30.24 399 2.70 SC-1 2.21 2.41 2.4 2.54 1.59 −28.48 440 2.72 SC-2 0.27 0.73 3.17 0.01 0.02 −27.8 443 2.23 SC-3 0.58 1.41 2.14 0.96 2.85 −28.22 439 2.80 SC-4 1.91 1.98 1.52 0.03 0.05 −27.74 582 2.86 SC-5 0.38 0.79 1.32 0.08 0.03 −27.85 309 2.40 SC-6 2 2.3 1.8 0.16 0.11 −28.34 301 2.42 注:TOC—有机碳含量;TC—总碳含量;TS—总硫含量;S1—游离烃量;S2—热解烃量;δ13CTOC—有机碳同位素;Tmax—岩石热解最高峰温度;Ro—镜质体反射率 表 2 不同方法恢复后TOC相关参数变化
Table 2 Changes in TOC-related parameters after recovery by different methods
恢复方法 化学动力法 反演法 正演法 物质平衡法 降解率法 干酪根恢复系数法 恢复TOC范围/% 0.27~2.66 0.27~5.80 0.45~5.22 0.45~6.00 0.45~5.99 0.59~7.75 恢复TOC平均值/% 1.29 1.93 2.36 2.68 2.56 3.59 平均TOC恢复系数 1.01 1.38 1.83 2.07 1.97 2.76 恢复S2范围/(mg·g−1) 5.16~104.07 0.09~38.88 0.24~34.97 0.24~40.22 2.15~43.28 0.41~51.94 恢复S2平均值/(mg·g−1) 13.89 7.91 10.09 13.14 16.11 19.85 表 3 Ⅰ型有机质烃源岩排烃过程各参数变化
Table 3 Variation of parameters in the process of hydrocarbon removal from type Ⅰ organic hydrocarbon source rock
成烃期 Ro/% 生烃转化率/% GPI/(mg·g−1) 排烃率/(mg·g−1) 排烃速率/[(mg·g−1)/(0.1%Ro)] TOC/% 排烃强度/(104t/km2) 排烃量/(108 t) 未熟期 0.50 0.00 722.89 0.00 0.00 3.10 0 0 0.60 0.00 722.89 0.00 0.00 3.10 0 0 主要成油期 0.70 0.00 722.89 0.00 0.00 3.10 0 0 0.80 9.52 654.04 68.85 68.85 2.71 203.64 61.835 0.90 20.95 571.43 151.46 82.62 2.36 389.57 118.293 1.00 38.10 447.50 275.39 123.92 1.97 592.40 179.884 1.10 56.19 316.69 406.20 130.81 1.68 745.09 226.250 1.20 70.48 213.42 509.47 103.27 1.51 837.18 254.212 1.30 80.00 144.58 578.31 68.85 1.41 888.60 269.827 主要成气期 1.40 87.14 92.94 629.95 51.64 1.34 922.99 280.269 1.50 91.43 61.96 660.93 30.98 1.31 942.13 286.081 1.60 93.33 48.19 674.70 13.77 1.29 950.31 288.565 1.70 95.24 34.42 688.47 13.77 1.27 958.29 290.990 1.80 96.19 27.54 695.35 6.88 1.27 962.22 292.181 1.90 96.95 22.03 700.86 5.51 1.26 965.32 293.124 2.00 97.33 19.28 703.61 2.75 1.26 966.86 293.592 过熟期 2.50 97.67 16.87 706.02 0.48 1.26 968.21 294.000 3.00 98.00 14.46 708.43 0.48 1.25 969.54 294.406 3.50 98.33 12.05 710.84 0.48 1.25 970.88 294.811 4.00 98.67 9.64 713.25 0.48 1.25 972.20 295.214 4.50 99.00 7.23 715.66 0.48 1.25 973.53 295.615 5.00 99.33 4.82 718.07 0.48 1.24 974.84 296.015 5.50 99.67 2.41 720.48 0.48 1.24 976.15 296.413 6.00 100.00 0.00 722.89 0.48 1.24 977.46 296.809 表 4 Ⅱ1型有机质烃源岩排烃过程各参数变化
Table 4 Variation of parameters in the hydrocarbon drainage process of type Ⅱ1 organic hydrocarbon source rock
成烃期 Ro/% 生烃转化率/% GPI/(mg·g−1) 排烃率/(mg·g−1) 排烃速率/[(mg·g−1)/(0.1%Ro)] TOC/% 排烃强度/(104t/km2) 排烃量/(108 t) 未熟期 0.50 0.00 481.93 0.00 0.00 2.06 0.00 0 0.60 0.00 481.93 0.00 0.00 2.06 0.00 0 主要成油期 0.70 0.00 481.93 0.00 0.00 2.06 0.00 0 0.80 0.08 444.28 37.65 37.65 1.95 71.21 21.622 0.90 0.17 399.10 82.83 45.18 1.84 147.87 44.901 1.00 0.32 327.56 154.37 71.54 1.69 253.10 76.856 1.10 0.52 233.43 248.49 94.13 1.53 367.96 111.731 1.20 0.66 165.66 316.27 67.77 1.43 437.77 132.929 1.30 0.76 116.72 365.21 48.95 1.37 482.78 146.597 主要成气期 1.40 0.84 75.30 406.63 41.42 1.32 517.81 157.236 1.50 0.91 43.67 438.25 31.63 1.28 542.89 164.850 1.60 0.95 26.36 455.57 17.32 1.26 556.05 168.846 1.70 0.96 21.08 460.84 5.27 1.25 559.98 170.039 1.80 0.97 15.06 466.87 6.02 1.25 564.42 171.390 1.90 0.98 11.30 470.63 3.77 1.24 567.18 172.227 2.00 0.98 7.53 474.40 3.77 1.24 569.92 173.059 过熟期 2.50 0.99 6.59 475.34 0.19 1.24 570.60 173.266 3.00 0.99 5.65 476.28 0.19 1.24 571.28 173.473 3.50 0.99 4.71 477.22 0.19 1.24 571.96 173.679 4.00 0.99 3.77 478.16 0.19 1.24 572.64 173.885 4.50 0.99 2.82 479.10 0.19 1.24 573.32 174.091 5.00 1.00 1.88 480.05 0.19 1.23 574.00 174.297 5.50 1.00 0.94 480.99 0.19 1.23 574.67 174.502 6.00 1.00 0.00 481.93 0.19 1.23 575.35 174.707 -
Bai H, Pang X Q, Kuang L C, et al. 2017. Hydrocarbon expulsion potential of source rocks and its influence on the distribution of lacustrine tight oil reservoir, Middle Permian Lucaogou Formation, Jimsar Sag, Junggar Basin, Northwest China[J]. Journal of Petroleum Science and Engineering, 149: 740−755. doi: 10.1016/j.petrol.2016.09.053
Baskin D K. 1997. Atomic H/C ratio of kerogen as an estimate of thermal maturity and organic matter conversion[J]. AAPG Bulletin, 81(9): 1437−1450.
Cao Q Y. 1985. Identification of micro−components and types of kerogen under the transmitted light[J]. Petroleum Exploration and Development, 12(5): 14−32(in Chinese with English abstract).
Chen J P, Sun Y G, Zhong N N, et al. 2014. The efficiency and model of petroleum expulsion from the lacustrine source rocks within geological frame[J]. Acta Geologica Sinica, 88(11): 2005−2032(in Chinese with English abstract).
Cheng K M, Wang Z Y. 1996. An evaluation method of hydrocarbon generating potential of highly mature and over−mature marine carbonate[J]. Science in China( Series D), 26(6): 537−543(in Chinese with English abstract).
Cornford C, Gardner P, Burgess C. 1998. Geochemical truths in large data sets. I: Geochemical screening data[J]. Organic Geochemistry, 29(1): 519−530.
Craig J, Luening S, Beswetherick S, et al. 2008. Structural styles and prospectivity in the Precambrian and Palaeozoic hydrocarbon systems of North Africa[J]. Geology of East Libya, 4: 51−122.
Espitalie J. 1986. Use of Tmax as a maturation index for different types of organic matter, Comparison with vitrinite reflectance[M]. Paris: Editions Technip: 475−496.
Fu W, Hou H, Gao R, et al. 2021. Lithospheric structures of the central Solonker−Xar Moron−Changchun−Yanji Suture (Inner Mongolia) revealed by a deep seismic reflection profile[J]. Tectonophysics, 817: 229043. doi: 10.1016/j.tecto.2021.229043
Hakimi M H, Abdullah W H. 2014. Source rock characteristics and hydrocarbon generation modelling of Upper Cretaceous Mukalla Formation in the Jiza−Qamar Basin, Eastern Yemen[J]. Marine and Petroleum Geology, 51: 100−116. doi: 10.1016/j.marpetgeo.2013.11.022
Hu T, Pang X Q, Yu S, et al. 2016. Hydrocarbon generation and expulsion characteristics of Lower Permian P1f source rocks in the Fengcheng area, northwest margin, Junggar Basin, NW China: implications for tight oil accumulation potential assessment[J]. Geological Journal, 51(6): 880−900. doi: 10.1002/gj.2705
Huang D F, Li J C, Zhang D J. 1984. Kerogen types and study on effectiveness, limitation and interrelation of their identification parameters[J]. Acta Sedimentologica Sinica, 2(3): 18−33(in Chinese with English abstract).
Huang Z L, Wang B, Zhang X Q, et al. 2013. Evaluation on gas generation potential of Upper Paleozoic source rock in Songliao Basin[J]. Journal of Earth Sciences & Environment, 35(3): 55−65(in Chinese with English abstract).
Hunt J M. 1979. Petroleum geochemistry and geology[M]. New York: Freman.
Jarvie D M, Hill R J, Ruble T E, et al. 2007. Unconventional shale−gas systems: The mississippian Barnett Shale of north−central Texas as one model for thermogenic shale−gas assessment[J]. AAPG Bulletin, 91(4): 475−499. doi: 10.1306/12190606068
Jia C Z, Pang X Q. 2015. Research processes and main development directions of deep hydrocarbon geological theories[J]. Acta Petrolei Sinica, 36(12): 1457.
Jia J, Bechtel A, Liu Z, et al. 2013. Oil shale formation in the Upper Cretaceous Nenjiang Formation of the Songliao Basin (NE China): Implications from organic and inorganic geochemical analyses[J]. International Journal of Coal Geology, 113: 11−26. doi: 10.1016/j.coal.2013.03.004
Jiang H, Pang X Q, Shi H S, et al. 2015. Source rock characteristics and hydrocarbon expulsion potential of the Middle Eocene Wenchang formation in the Huizhou depression, Pearl River Mouth basin, south China sea[J]. Marine and Petroleum Geology, 67: 635−652. doi: 10.1016/j.marpetgeo.2015.06.010
Jin Q. 1989. The restoration of initial organic carbon in source rocks[J]. Journal of the University of Petroleum, China,13(5): 1−10(in Chinese with English abstract).
Li C R, Pang X Q, Huo Z P, et al. 2020. A revised method for reconstructing the hydrocarbon generation and expulsion history and evaluating the hydrocarbon resource potential: Example from the first member of the Qingshankou Formation in the Northern Songliao Basin, Northeast China[J]. Marine and Petroleum Geology, 121: 104577. doi: 10.1016/j.marpetgeo.2020.104577
Li C R, Pang X Q, Ma X H, et al. 2021. Hydrocarbon generation and expulsion characteristics of the Lower Cambrian Qiongzhusi shale in the Sichuan Basin, Central China: Implications for conventional and unconventional natural gas resource potential[J]. Journal of Petroleum Science and Engineering, 204: 108610. doi: 10.1016/j.petrol.2021.108610
Lu S F, Liu X Y, Qu J Y, et al. 1995. Restoring of original hydrocarbon potential and original organic carbon of source rocks in Huhehu Depression Hailar Basin[J]. Journal of Daqing Petroleum Institute, 19(1): 31−34(in Chinese with English abstract).
Lu X Y, Huang Z L, Wang B, et al. 2013. Research of Carboniferous−Permian thermal history in Zhaoyuan area of Songliao basin[J]. Natural Gas Geoscience, 24(3): 548−554(in Chinese with English abstract).
Ma Z Z, Pang X Q, Sun J K, et al. 2009. Some problems about implication of hydrocarbon−generation potential method on research the expulsion characteristics of source rocks[J]. Journal of Southwest Petroleum University (Science & Technology Edition), 31(1): 14−18(in Chinese with English abstract).
Niu D M, Sun P C, Bai Y Y, et al. 2023. An FR–IR model method for restoring the original organic geochemical parameters of high over−mature source rocks with types I and II kerogen in China[J]. Geoenergy Science and Engineering, 228: 211971. doi: 10.1016/j.geoen.2023.211971
Pang X Q, Li M W, Li S M, et al. 2005. Geochemistry of petroleum systems in the Niuzhuang South Slope of Bohai Bay Basin: Part 3. Estimating hydrocarbon expulsion from the Shahejie formation[J]. Organic Geochemistry, 36(4): 497−510. doi: 10.1016/j.orggeochem.2004.12.001
Pang X Q, Li Q W, Chen J F. 2014. Recovery method of original TOC and its application in source rocks at high mature−over mature stage in deep petroliferous basins[J]. Journal of Palaeogeography, 16(6): 769−789(in Chinese with English abstract).
Peng J W, Pang X Q, Shi H S, et al. 2016. Hydrocarbon generation and expulsion characteristics of Eocene source rocks in the Huilu area, northern Pearl River Mouth basin, South China Sea: Implications for tight oil potential[J]. Marine and Petroleum Geology, 72: 463−487. doi: 10.1016/j.marpetgeo.2016.02.006
Peters K E, Cassa M R. 1994. Applied source rock geochemistry[J]. AAPG, Memoirs.60: 93−117.
Ren S M, Qiao D W, Zhang X Z, et al. 2011. The present situation of oil & gas resources exploration and strategic selection of potential area in the Upper Paleozoic of Songliao Basin and surrounding area, NE China[J]. Geological Bulletin of China, 30(2/3): 197−204(in Chinese with English abstract).
Ren Z L, Xiao D M, Chi Y L, et al. 2011. Restoration of thermal history of the Permo−Carboniferous basement in the Songliao Basin[J]. Oil & Gas Geology, 32(3): 430−439(in Chinese with English abstract).
Schwangler M, Harris N B, Waldron J W F. 2020. Source rock characterization and oil−to−source rock correlation of a Cambrian−Ordovician fold−and−thrust belt petroleum system, western Newfoundland[J]. Marine and Petroleum Geology, 115: 104283. doi: 10.1016/j.marpetgeo.2020.104283
Shi C H, Cao J, Selby D, et al. 2020. Hydrocarbon evolution of the over−mature Sinian Dengying reservoir of the Neoproterozoic Sichuan Basin, China: Insights from Re–Os geochronology[J]. Marine and Petroleum Geology, 122: 104726. doi: 10.1016/j.marpetgeo.2020.104726
Song Y, Ren J, Liu K, et al. 2018. Post−rift anomalous thermal flux in the Songliao Basin, NE China, as revealed from fission track thermochronology and tectonic analysis[J]. Palaeogeography, Palaeoclimatology, Palaeoecology, 508: 148−165.
Song Y, Ren J, Stepashko A A, et al. 2014. Post−rift geodynamics of the Songliao Basin, NE China: Origin and significance of T11 (Coniacian) unconformity[J]. Tectonophysics, 634: 1−18. doi: 10.1016/j.tecto.2014.07.023
Tissot B, Welte D H. 1984. Petroleum formation and occurence[M]. Berlin Heidelberg New York: 699.
Wang C W, Sun Y W, Li N, et al. 2009. On the distribution of late Palaeozoic strata in Northeast China[J]. Journal of Stratigraphy, 33(1): 56−61(in Chinese with English abstract).
Wang E, Liu G Y, Pang X Q, et al. 2020. An improved hydrocarbon generation potential method for quantifying hydrocarbon generation and expulsion characteristics with application example of Paleogene Shahejie Formation, Nanpu Sag, Bohai Bay Basin[J]. Marine and Petroleum Geology, 112: 104106. doi: 10.1016/j.marpetgeo.2019.104106
Wang Z, Wang J, Yu F, et al. 2021. Geochemical characteristics of the Upper Triassic black mudstones in the eastern Qiangtang Basin, Tibet: Implications for petroleum potential and depositional environment[J]. Journal of Petroleum Science and Engineering, 207: 109180. doi: 10.1016/j.petrol.2021.109180
Xiao D, Cao J, Luo B, et al. 2021. Neoproterozoic postglacial paleoenvironment and hydrocarbon potential: A review and new insights from the Doushantuo Formation Sichuan Basin, China[J]. Earth−Science Reviews, 212: 103453. doi: 10.1016/j.earscirev.2020.103453
Xing D Q, Liu Y J, Tang Z X, et al. 2015. Research on Upper Paleozoic tectonic framework and evolution of Songliao Basin[J]. Global Geology, 34(2): 396−407(in Chinese with English abstract).
Zhao Q F, Xie D Z, Chen J W, et al. 2023. Evaluation and biogenetic derivation and sedimentary environment of source rocks from Permian in the Lower Yangze region[J]. Geological Bulletin of China, 42(7): 1154−1165 (in Chinese with English abstract).
Zhao Z K, Jiang T, He J L. 2011. The oil and gas exploration prospect of Carboniferous—Permian in Songliao basin, northeastern China[J]. Geological Bulletin of China, 30(2): 221−227(in Chinese with English abstract).
Zheng D Y, Pang X Q, Ma X H, et al. 2019. Hydrocarbon generation and expulsion characteristics of the source rocks in the third member of the Upper Triassic Xujiahe Formation and its effect on conventional and unconventional hydrocarbon resource potential in the Sichuan Basin[J]. Marine and Petroleum Geology, 109: 175−192. doi: 10.1016/j.marpetgeo.2019.06.014
Zheng Y J, Huang X, Sun Y W, et al. 2018. The Carboniferous−Permian stratigraphic division and correlation in the Songliao Basin and its peripheral areas[J]. Geology and Resources, 27(1): 1−15(in Chinese with English abstract).
Zhu D F, Ren Y G, Wu H Y, et al. 2007. A preliminary study on the buried Permian and Jurassic in the Northern Songliao Basin[J]. Chinese Journal of Geology, 42(4): 690−708,778(in Chinese with English abstract).
Zhu G Y, Zhang Z Y, Zhou X X, et al. 2019. The complexity, secondary geochemical process, genetic mechanism and distribution prediction of deep marine oil and gas in the Tarim Basin, China[J]. Earth−Science Reviews, 198: 102930. doi: 10.1016/j.earscirev.2019.102930
Zhu G, Jiang D Z, Zhang B L, et al. 2012. Destruction of the eastern North China Craton in a backarc setting: Evidence from crustal deformation kinematics[J]. Gondwana Research, 22(1): 86−103. doi: 10.1016/j.gr.2011.08.005
曹庆英. 1985. 透射光下干酪根显微组分鉴定及类型划分[J]. 石油勘探与开发, (5): 14−23,81−88. 陈建平, 孙永革, 钟宁宁, 等. 2014. 地质条件下湖相烃源岩生排烃效率与模式[J]. 地质学报, 88(11): 2005−2032. 程克明, 王兆云. 1996. 高成熟和过成熟海相碳酸盐岩生烃条件评价方法研究[J]. 中国科学(D辑: 地球科学), (6): 537−543. 黄第藩, 李晋超, 张大江. 1984. 干酪根的类型及其分类参数的有效性、局限性和相关性[J]. 沉积学报, (3): 18−33,135−136. 黄志龙, 王斌, 张秀颀, 等. 2013. 松辽盆地上古生界烃源岩生气潜力评价[J]. 地球科学与环境学报, 35(3): 55−65. doi: 10.3969/j.issn.1672-6561.2013.03.005 金强. 1989. 生油岩原始有机碳恢复方法的探讨[J]. 石油大学学报(自然科学版), (5): 1−10. 卢双舫, 刘晓艳, 曲佳燕, 等. 1995. 海拉尔盆地呼和湖凹陷烃源岩原始生烃潜力和原始有机碳的恢复[J]. 大庆石油学院学报, (1): 31−34. 逯晓喻, 黄志龙, 王斌, 等. 2013. 松辽盆地肇源地区石炭系—二叠系热演化史研究[J]. 天然气地球科学, 24(3): 548−554. 马中振, 庞雄奇, 孙俊科, 等. 2009. 生烃潜力法在排烃研究中应注意的几个问题[J]. 西南石油大学学报(自然科学版), 31(1): 14−18. 庞雄奇, 李倩文, 陈践发, 等. 2014. 含油气盆地深部高过成熟烃源岩古TOC恢复方法及其应用[J]. 古地理学报, 16(6): 769−789. doi: 10.7605/gdlxb.2014.06.062 任收麦, 乔德武, 张兴洲, 等. 2011. 松辽盆地及外围上古生界油气资源战略选区研究进展[J]. 地质通报, 30(2/3): 197−204. doi: 10.3969/j.issn.1671-2552.2011.02.003 任战利, 萧德铭, 迟元林, 等. 2011. 松辽盆地基底石炭—二叠系热演化史[J]. 石油与天然气地质, 32(3): 430−439. 王成文, 孙跃武, 李宁, 等. 2009. 东北地区晚古生代地层分布规律[J]. 地层学杂志, 33(1): 56−61. doi: 10.3969/j.issn.0253-4959.2009.01.006 邢大全, 刘永江, 唐振兴, 等. 2015. 松辽盆地上古生界构造格局及演化探究[J]. 世界地质, 34(2): 396−407. doi: 10.3969/j.issn.1004-5589.2015.02.015 赵青芳, 谢德智, 陈建文, 等. 2023. 下扬子区二叠系烃源岩评价与生源环境[J]. 地质通报, 42(7): 1154−1165. 赵志魁, 江涛, 贺君玲. 2011. 松辽盆地石炭系—二叠系油气勘探前景[J]. 地质通报, 30(2): 221−227. doi: 10.3969/j.issn.1671-2552.2011.02.006 郑月娟, 黄欣, 孙跃武, 等. 2018. 松辽盆地及外围石炭系—二叠系划分与对比[J]. 地质与资源, 27(1): 1−15. doi: 10.3969/j.issn.1671-1947.2018.01.001 朱德丰, 任延广, 吴河勇, 等. 2007. 松辽盆地北部隐伏二叠系和侏罗系的初步研究[J]. 地质科学, (4): 690−708, 778.


 下载:
下载:
