Analysis of groundwater level dynamic characteristics and influencing factors in Valley Plain of Lhasa City
-
摘要:
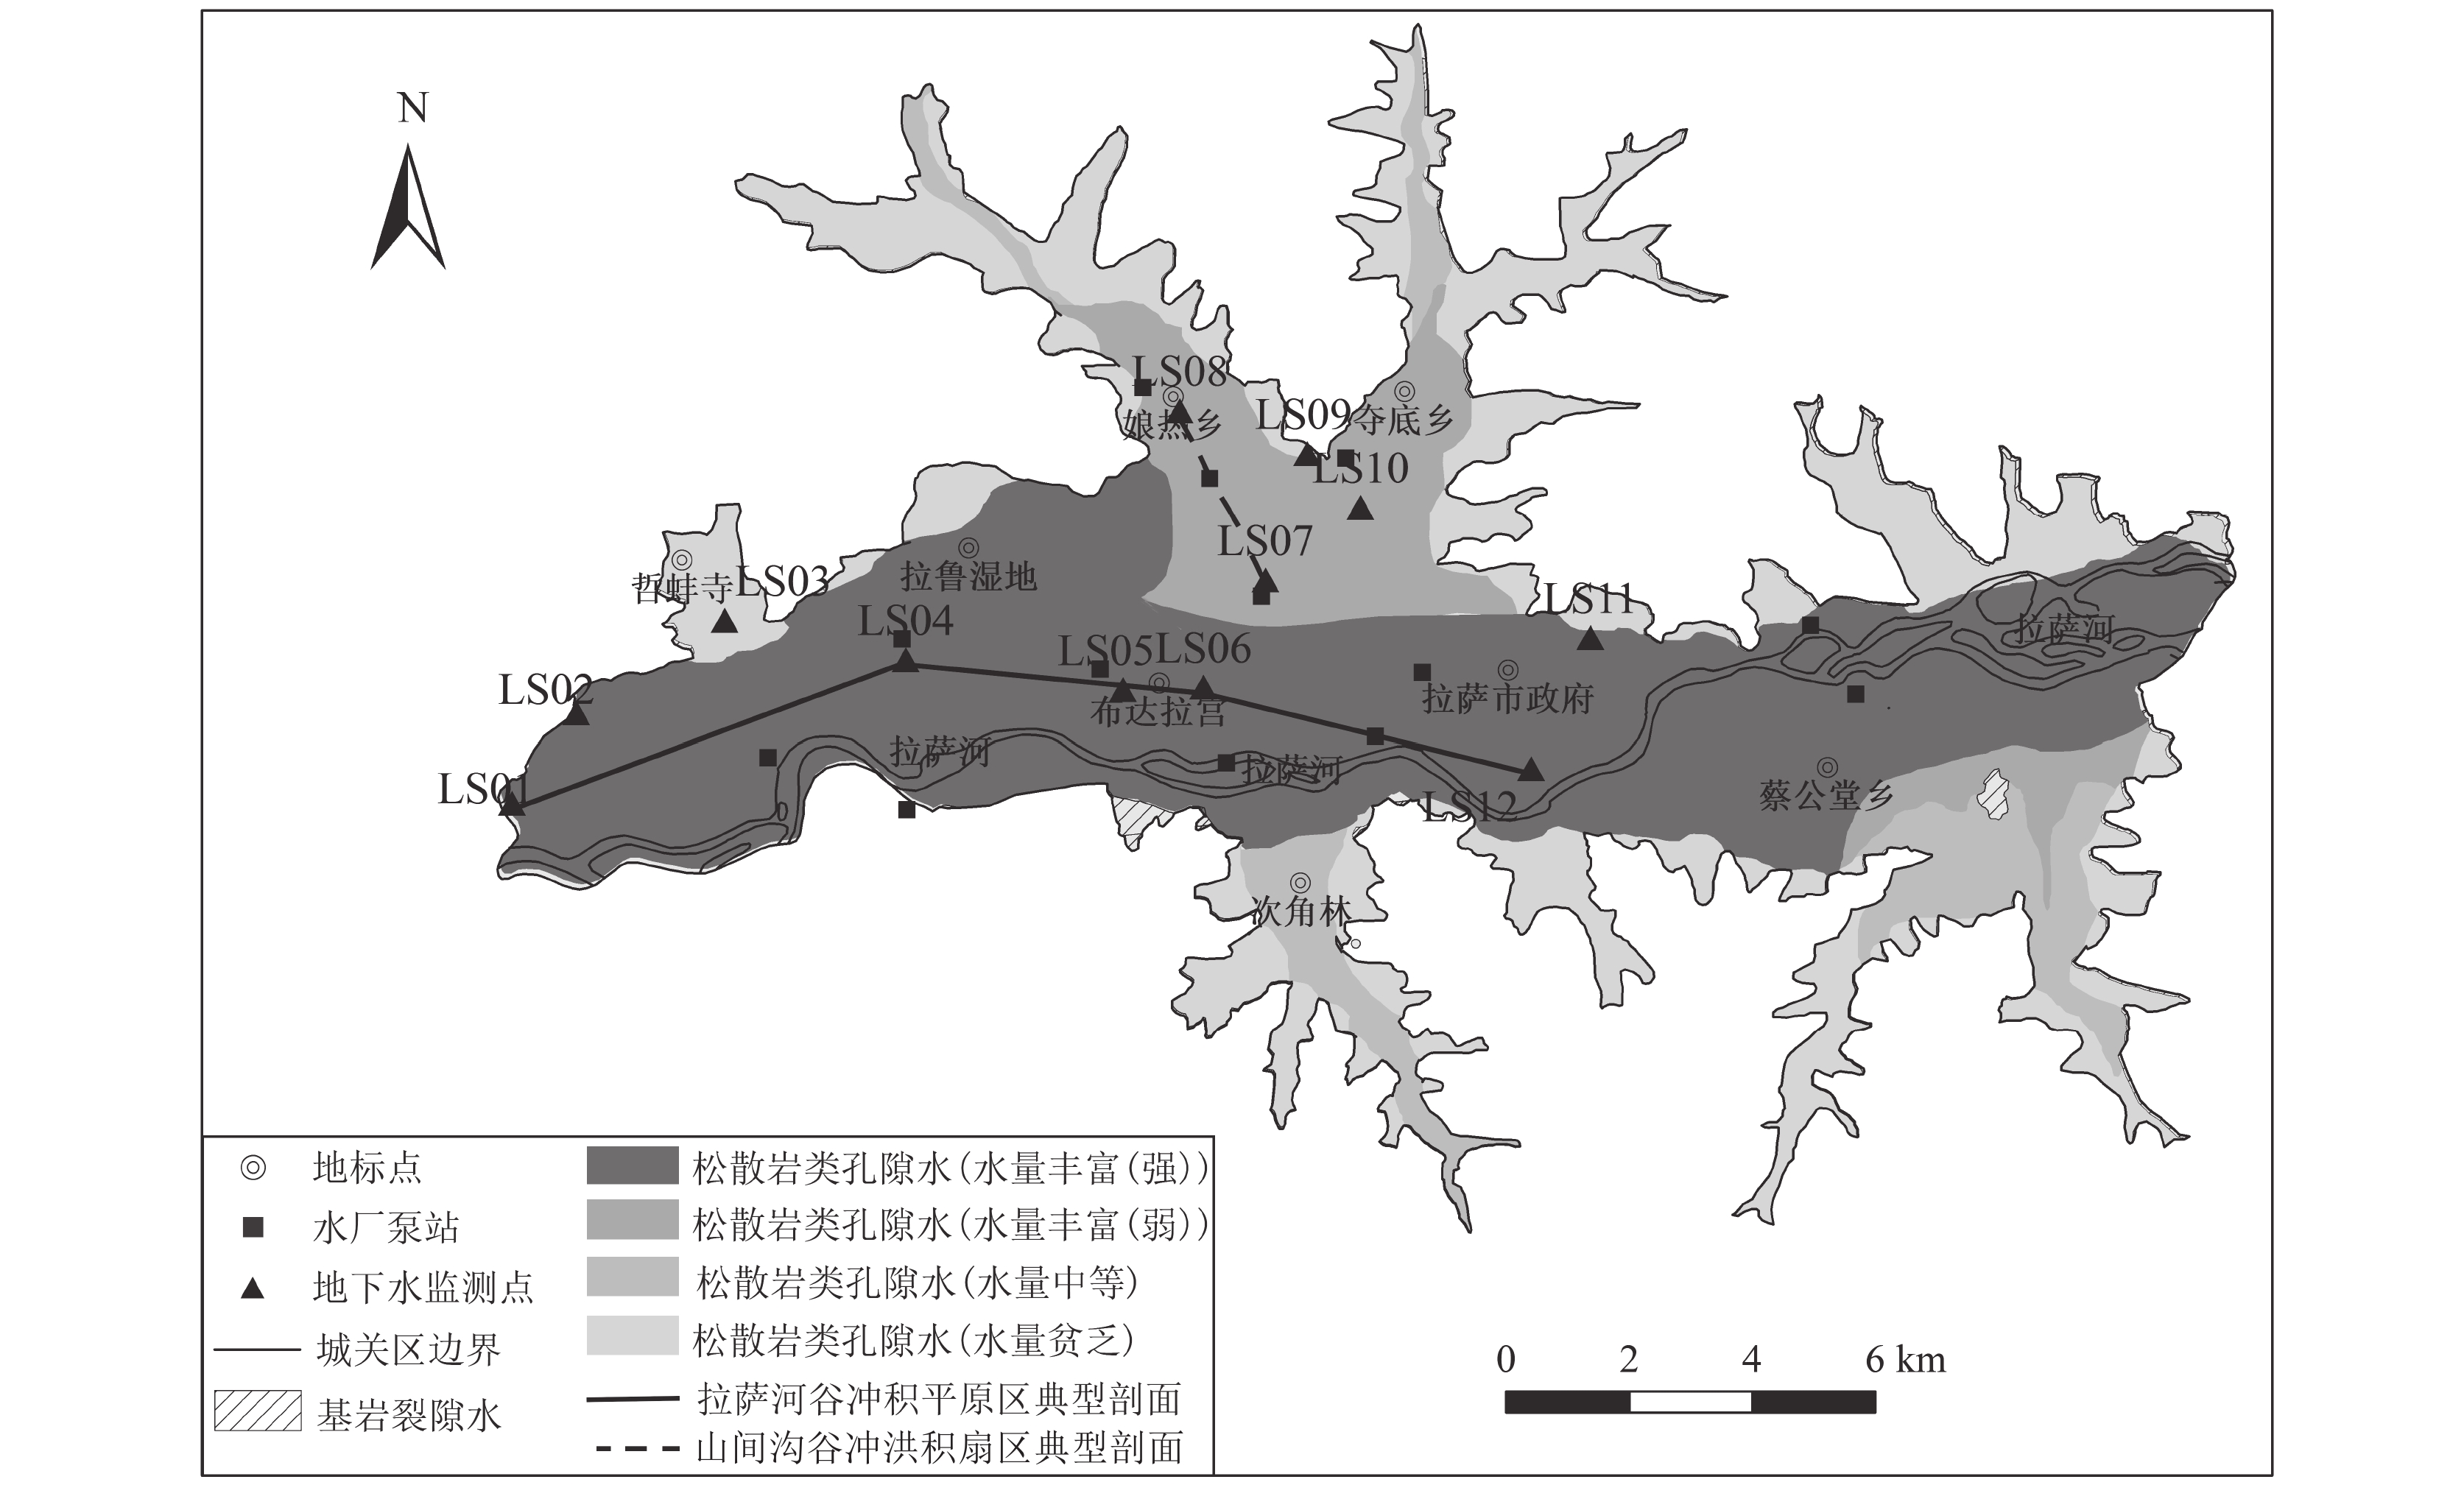
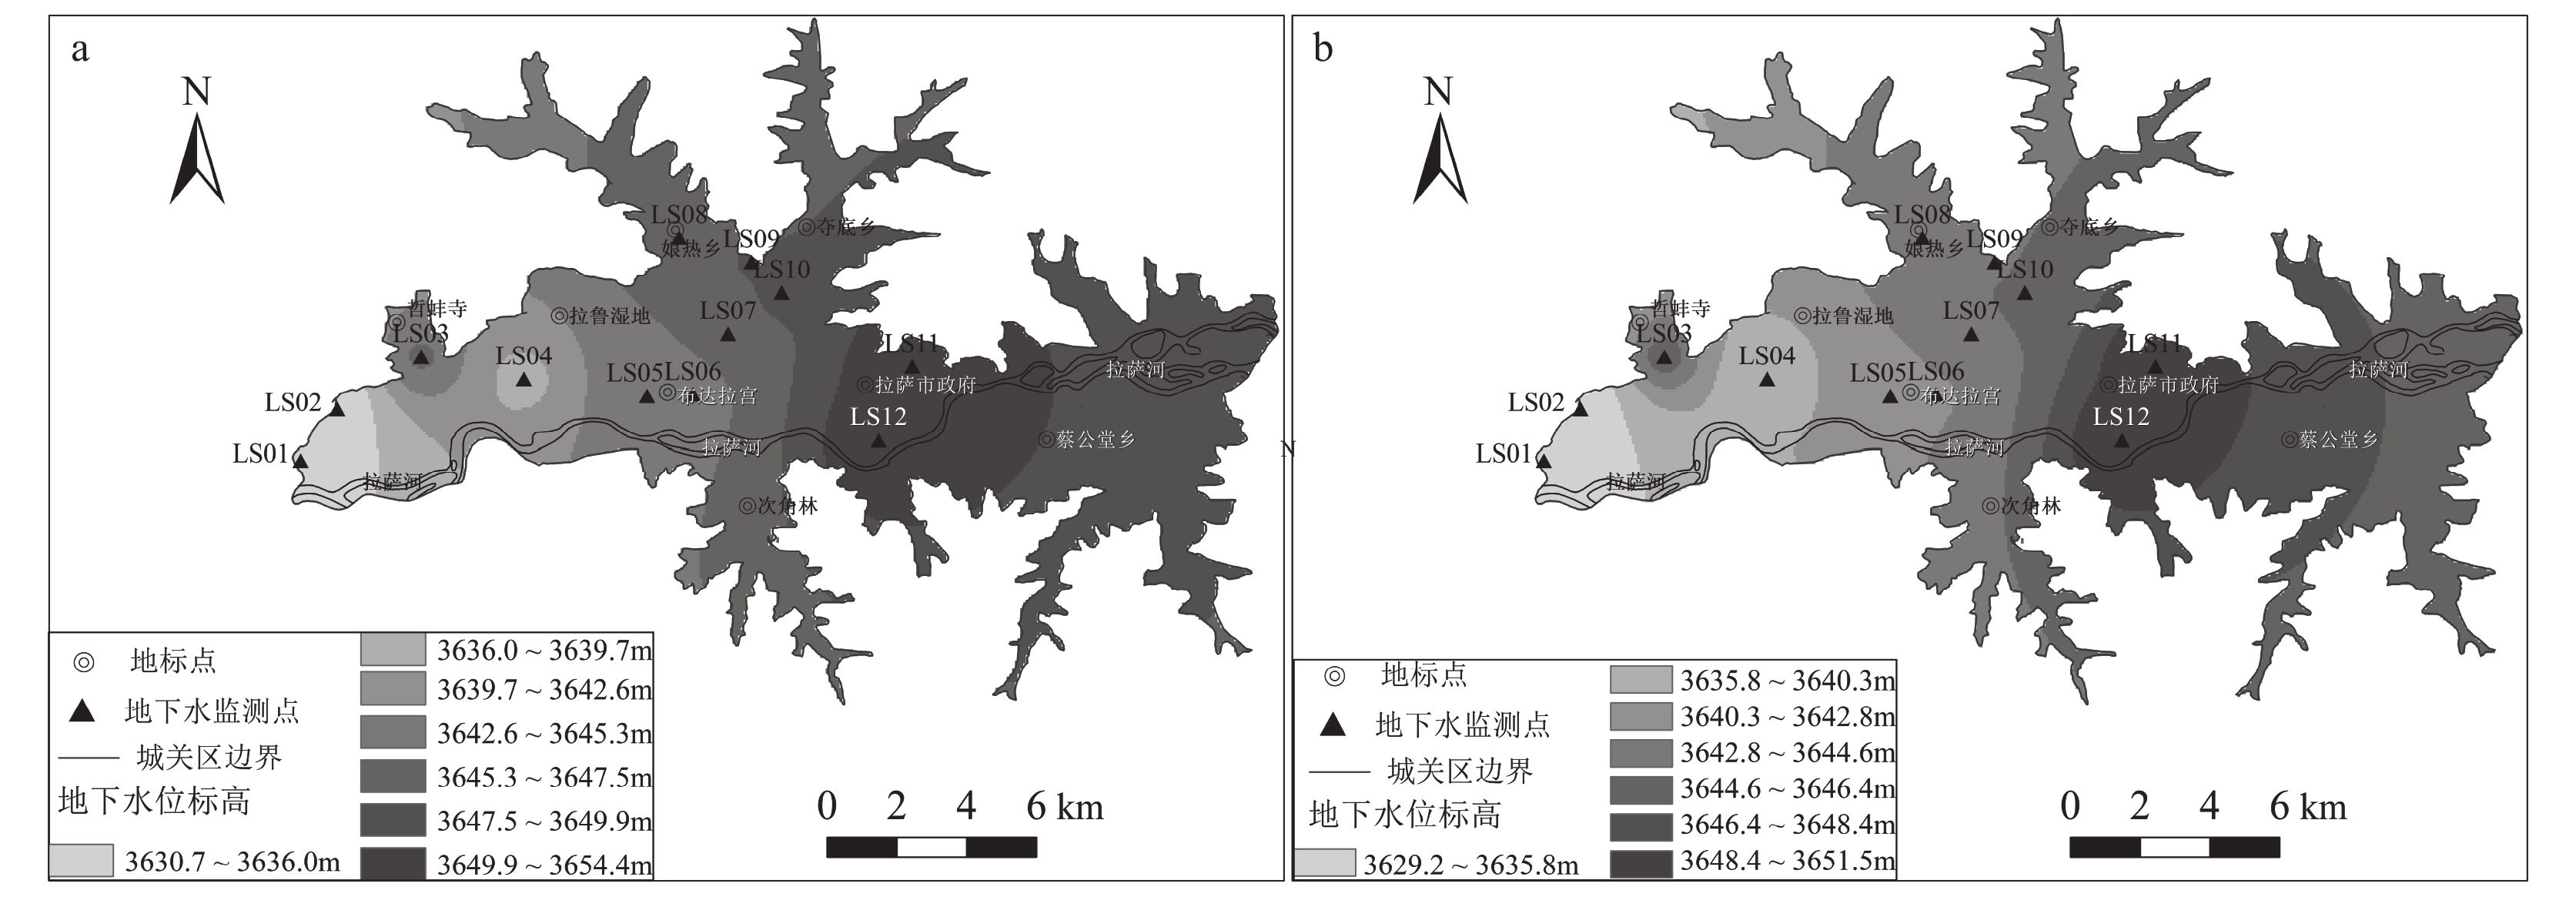
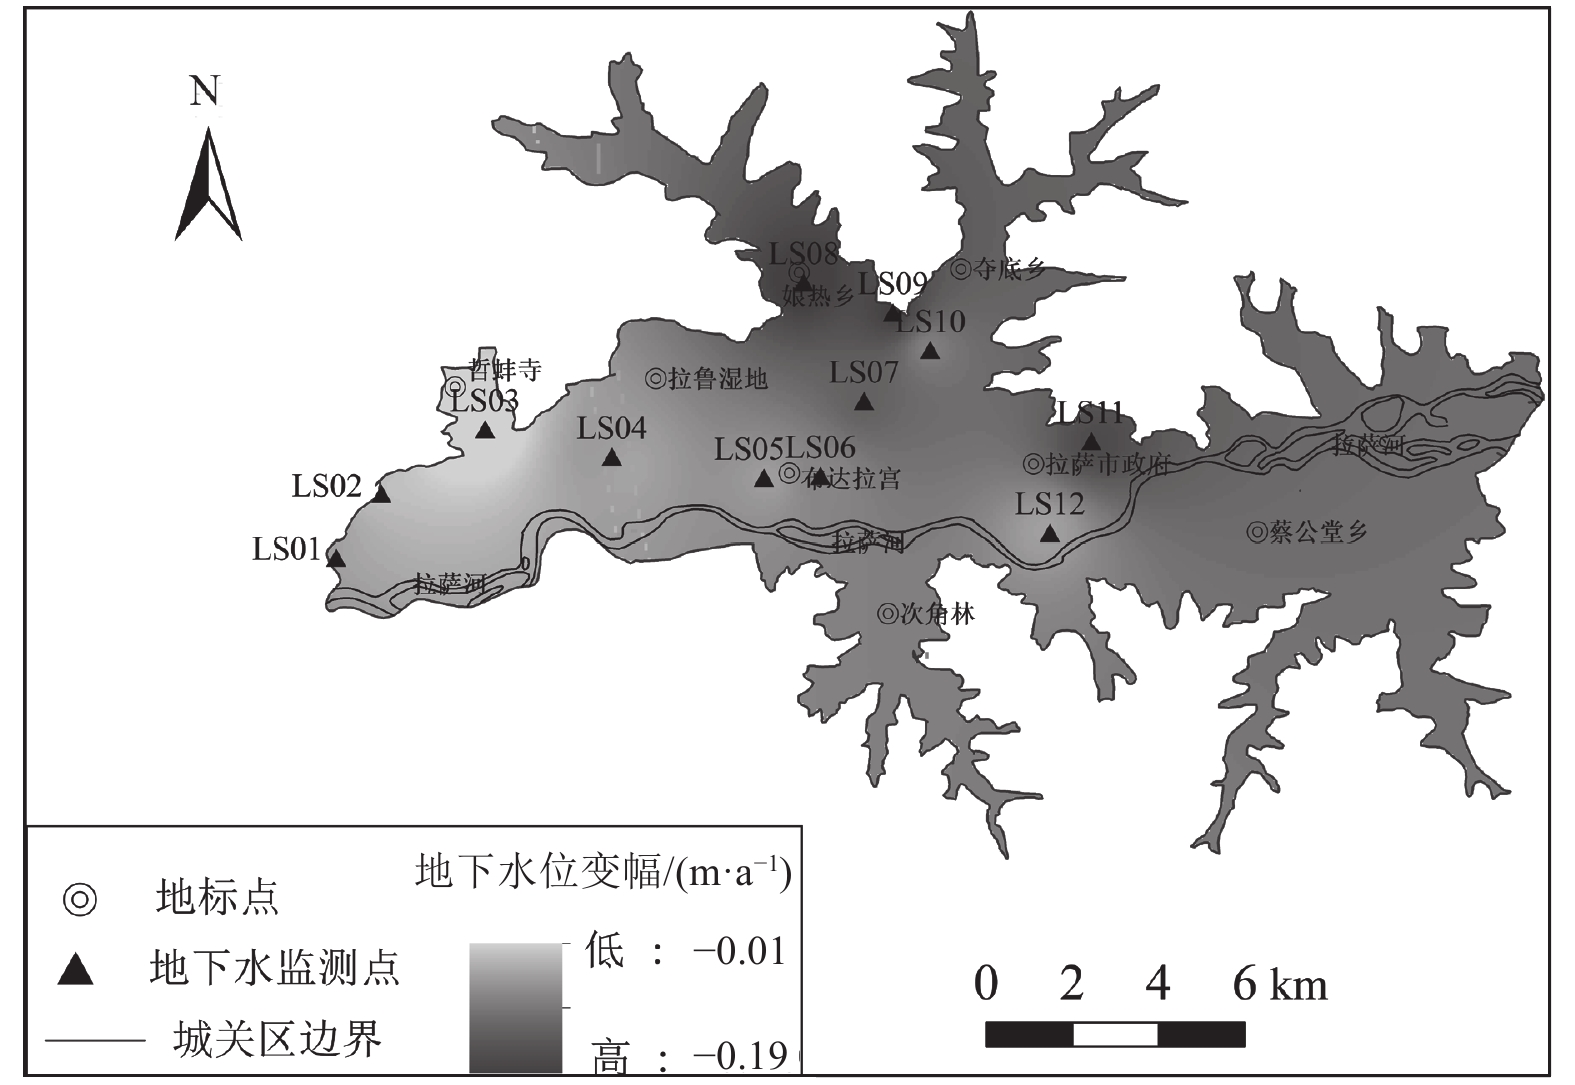
为加强拉萨市河谷平原区地下水资源的合理开发和可持续利用,以拉萨市城关区为例,对拉萨市河谷平原区地下水位动态特征及影响因素进行分析。对1996—2015年拉萨城关区地下水位进行了年内与年际变化特征分析,运用反距离加权法(IDW)进行空间插值,得出地下水位空间分布及变幅。利用Pearson相关分析法及灰色关联分析法对城关区地下水位动态的影响因素及各因素影响程度进行了分析。分析结果显示,城关区地下水位具有东高西低,中间高南北低的空间分布特征。1996—2015年间地下水位逐年下降,下降范围为0.2~3.7 m,年均降幅为0.01~0.19 m。地下水位动态受降水量、气温、开采量、建设用地面积的共同影响,影响程度为:气温>降水量>建设用地面积>开采量。
Abstract:In this paper, taking Chengguan District of Lhasa City as an example, the dynamic characteristics and influencing factors of groundwater in the valley plain of Lhasa City are analyzed. The intra−year and inter−annual variation characteristics of groundwater level from 1996 to 2015 in Chengguan District are analyzed, and the spatial interpolation of inverse distance weighting method(IDW)is used to obtain the spatial distribution and amplitude of groundwater level. The Pearson correlation analysis method and the Grey correlation method are used to analyze the influencing factors of groundwater level dynamics in Chengguan District and the degree of influence of each factor. The analysis results show that the groundwater level has the distribution characteristics of high in the east and low in the west, high in the middle, and low in the north and south. From 1996 to 2015, the groundwater level decreased year by year, with a decline range of 0.2~3.7 m, and an average annual decline is between 0.01 m and 0.19 m. The groundwater level is jointly affected by precipitation, temperature, extraction and the construction land area. The degree of influence is: the temperature > precipitation> the construction land area > the amount of groundwater extraction.
-
-
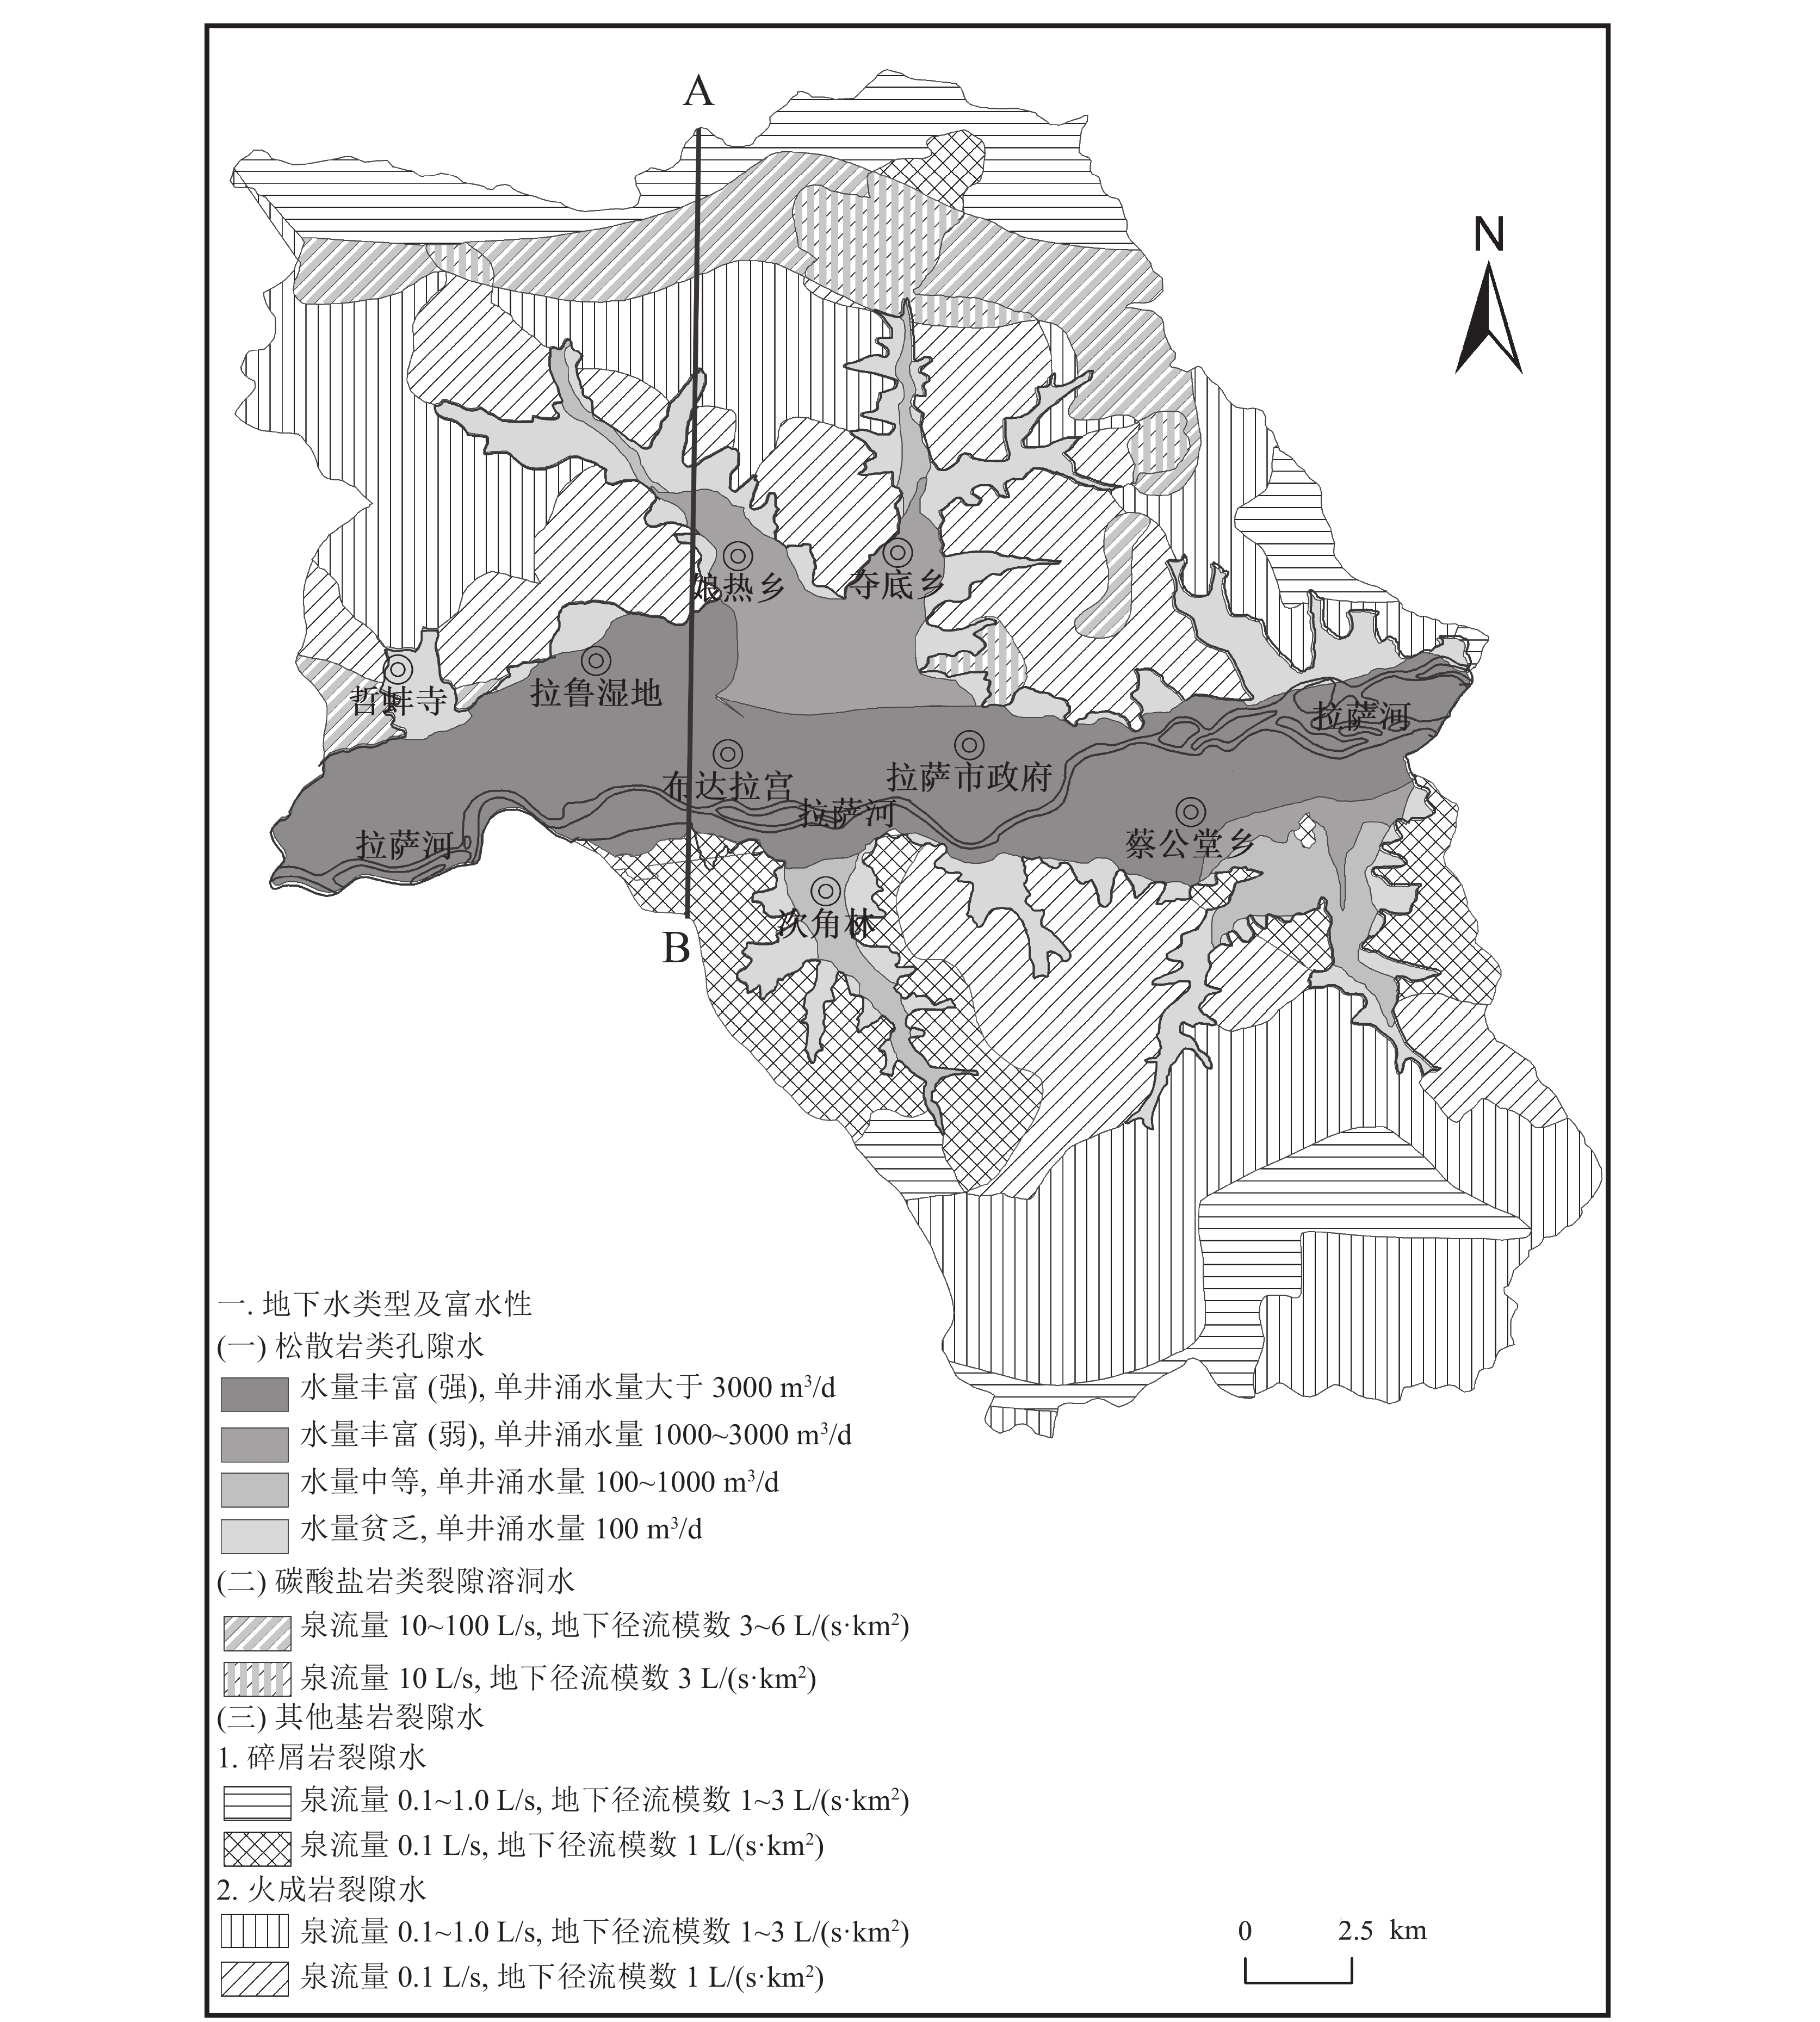
图 2 城关区A-B水文地质剖面(河谷平原区部分)(据刘久潭,2020)
K1-2m2—下白垩统马尔康组;J3d—上侏罗统当坝组;βγ6—喜马拉雅期花岗岩脉
Figure 2. A-B hydrogeological profile of Chengguan District (valley plain section)
表 1 城关区典型监测井年内平均地下水位变化
Table 1 Changes in the average groundwater level of typical monitoring wells in Chengguan District during the year
m 监测站点 1 2 3 4 5 6 7 8 9 10 11 12 LS01 3629.62 3629.56 3629.67 3629.64 3629.74 3629.89 3630.04 3630.09 3630.04 3629.88 3629.80 3629.65 LS12 3651.10 3651.05 3651.07 3651.25 3651.49 3652.01 3652.54 3652.59 3652.40 3651.98 3651.52 3651.25 LS07 3644.29 3644.20 3644.20 3644.16 3644.18 3644.43 3644.90 3645.15 3645.21 3644.89 3644.56 3644.26 LS08 3645.55 3645.35 3645.21 3645.08 3644.99 3645.15 3645.61 3646.14 3646.50 3646.36 3645.89 3645.60 表 2 1996—2015年城关区地下水位数据统计结果
Table 2 Statistical results of groundwater level data in Chengguan District from 1996 to 2015
m 年份 1996年 1997年 1998年 1999年 2000年 2001年 2002年 2003年 2004年 2005年 最大值 3654.42 3654.48 3654.54 3654.46 3654.43 3654.40 3654.33 3653.31 3653.21 3653.16 最小值 3630.35 3630.34 3630.36 3630.30 3630.36 3630.43 3630.38 3630.42 3630.21 3630.43 平均值 3644.23 3644.16 3644.25 3644.20 3644.21 3644.156 3643.90 3643.59 3643.57 3643.37 年份 2006年 2007年 2008年 2009年 2010年 2011年 2012年 2013年 2014年 2015年 最大值 3652.03 3651.71 3652.10 3651.98 3651.76 3651.67 3651.62 3651.40 3651.44 3651.25 最小值 3629.65 3629.62 3629.73 3629.71 3629.31 3629.05 3628.93 3628.91 3628.89 3628.75 平均值 3642.67 3642.50 3642.73 3642.70 3642.53 3642.42 3642.50 3642.42 3642.49 3642.22 表 3 城关区年降水量变化趋势检验结果
Table 3 Precipitation trend test results in Chengguan District
Spearman
统计量|T|临界值 Kendall
统计量|U|临界值 降水变化率
/(mm·a−1)趋势性 0.371 2.101 0.357 1.960 −5.445 不显著 表 4 城关区监测井地下水位与降水量相关性分析结果
Table 4 Correlation analysis results between groundwater level and precipitation in monitoring wells in Chengguan District
地貌分区 监测井号 相关系数 显著系数 山间沟谷冲洪积平原区 LS08 0.111 0.088 LS07 0.271** 0.000 拉萨河谷冲积平原区 LS012 0.562** 0.000 LS06 0.377** 0.000 LS04 0.302** 0.000 LS01 0.249** 0.000 注:**为在 0.01 级别(双尾)相关性显著 表 5 城关区气温趋势性检验结果
Table 5 Temperature trend test results in Chengguan District
Spearman
统计量|T|临界值 Kendall
统计量|U|临界值 气温变化率
/(℃·a−1)趋势性 3.625 2.101 2.758 1.960 0.046 显著 表 6 城关区监测井地下水位与气温相关性分析结果
Table 6 Correlation analysis results between groundwater level and temperature in monitoring wells in Chengguan District
地貌分区 监测井号 相关系数 显著系数 山间沟谷冲洪积平原区 LS08 −0.693** 0.001 LS07 −0.689** 0.001 拉萨河谷冲积平原区 LS012 −0.663** 0.001 LS06 −0.642** 0.002 LS04 −0.732** 0.000 LS01 −0.561* 0.010 注:*在 0.05 级别(双尾)相关性显著;**在 0.01 级别(双尾)相关性显著 表 7 城关区监测井地下水位与开采量相关性分析结果
Table 7 Correlation analysis results between groundwater level and extraction volume of monitoring wells in Chengguan District
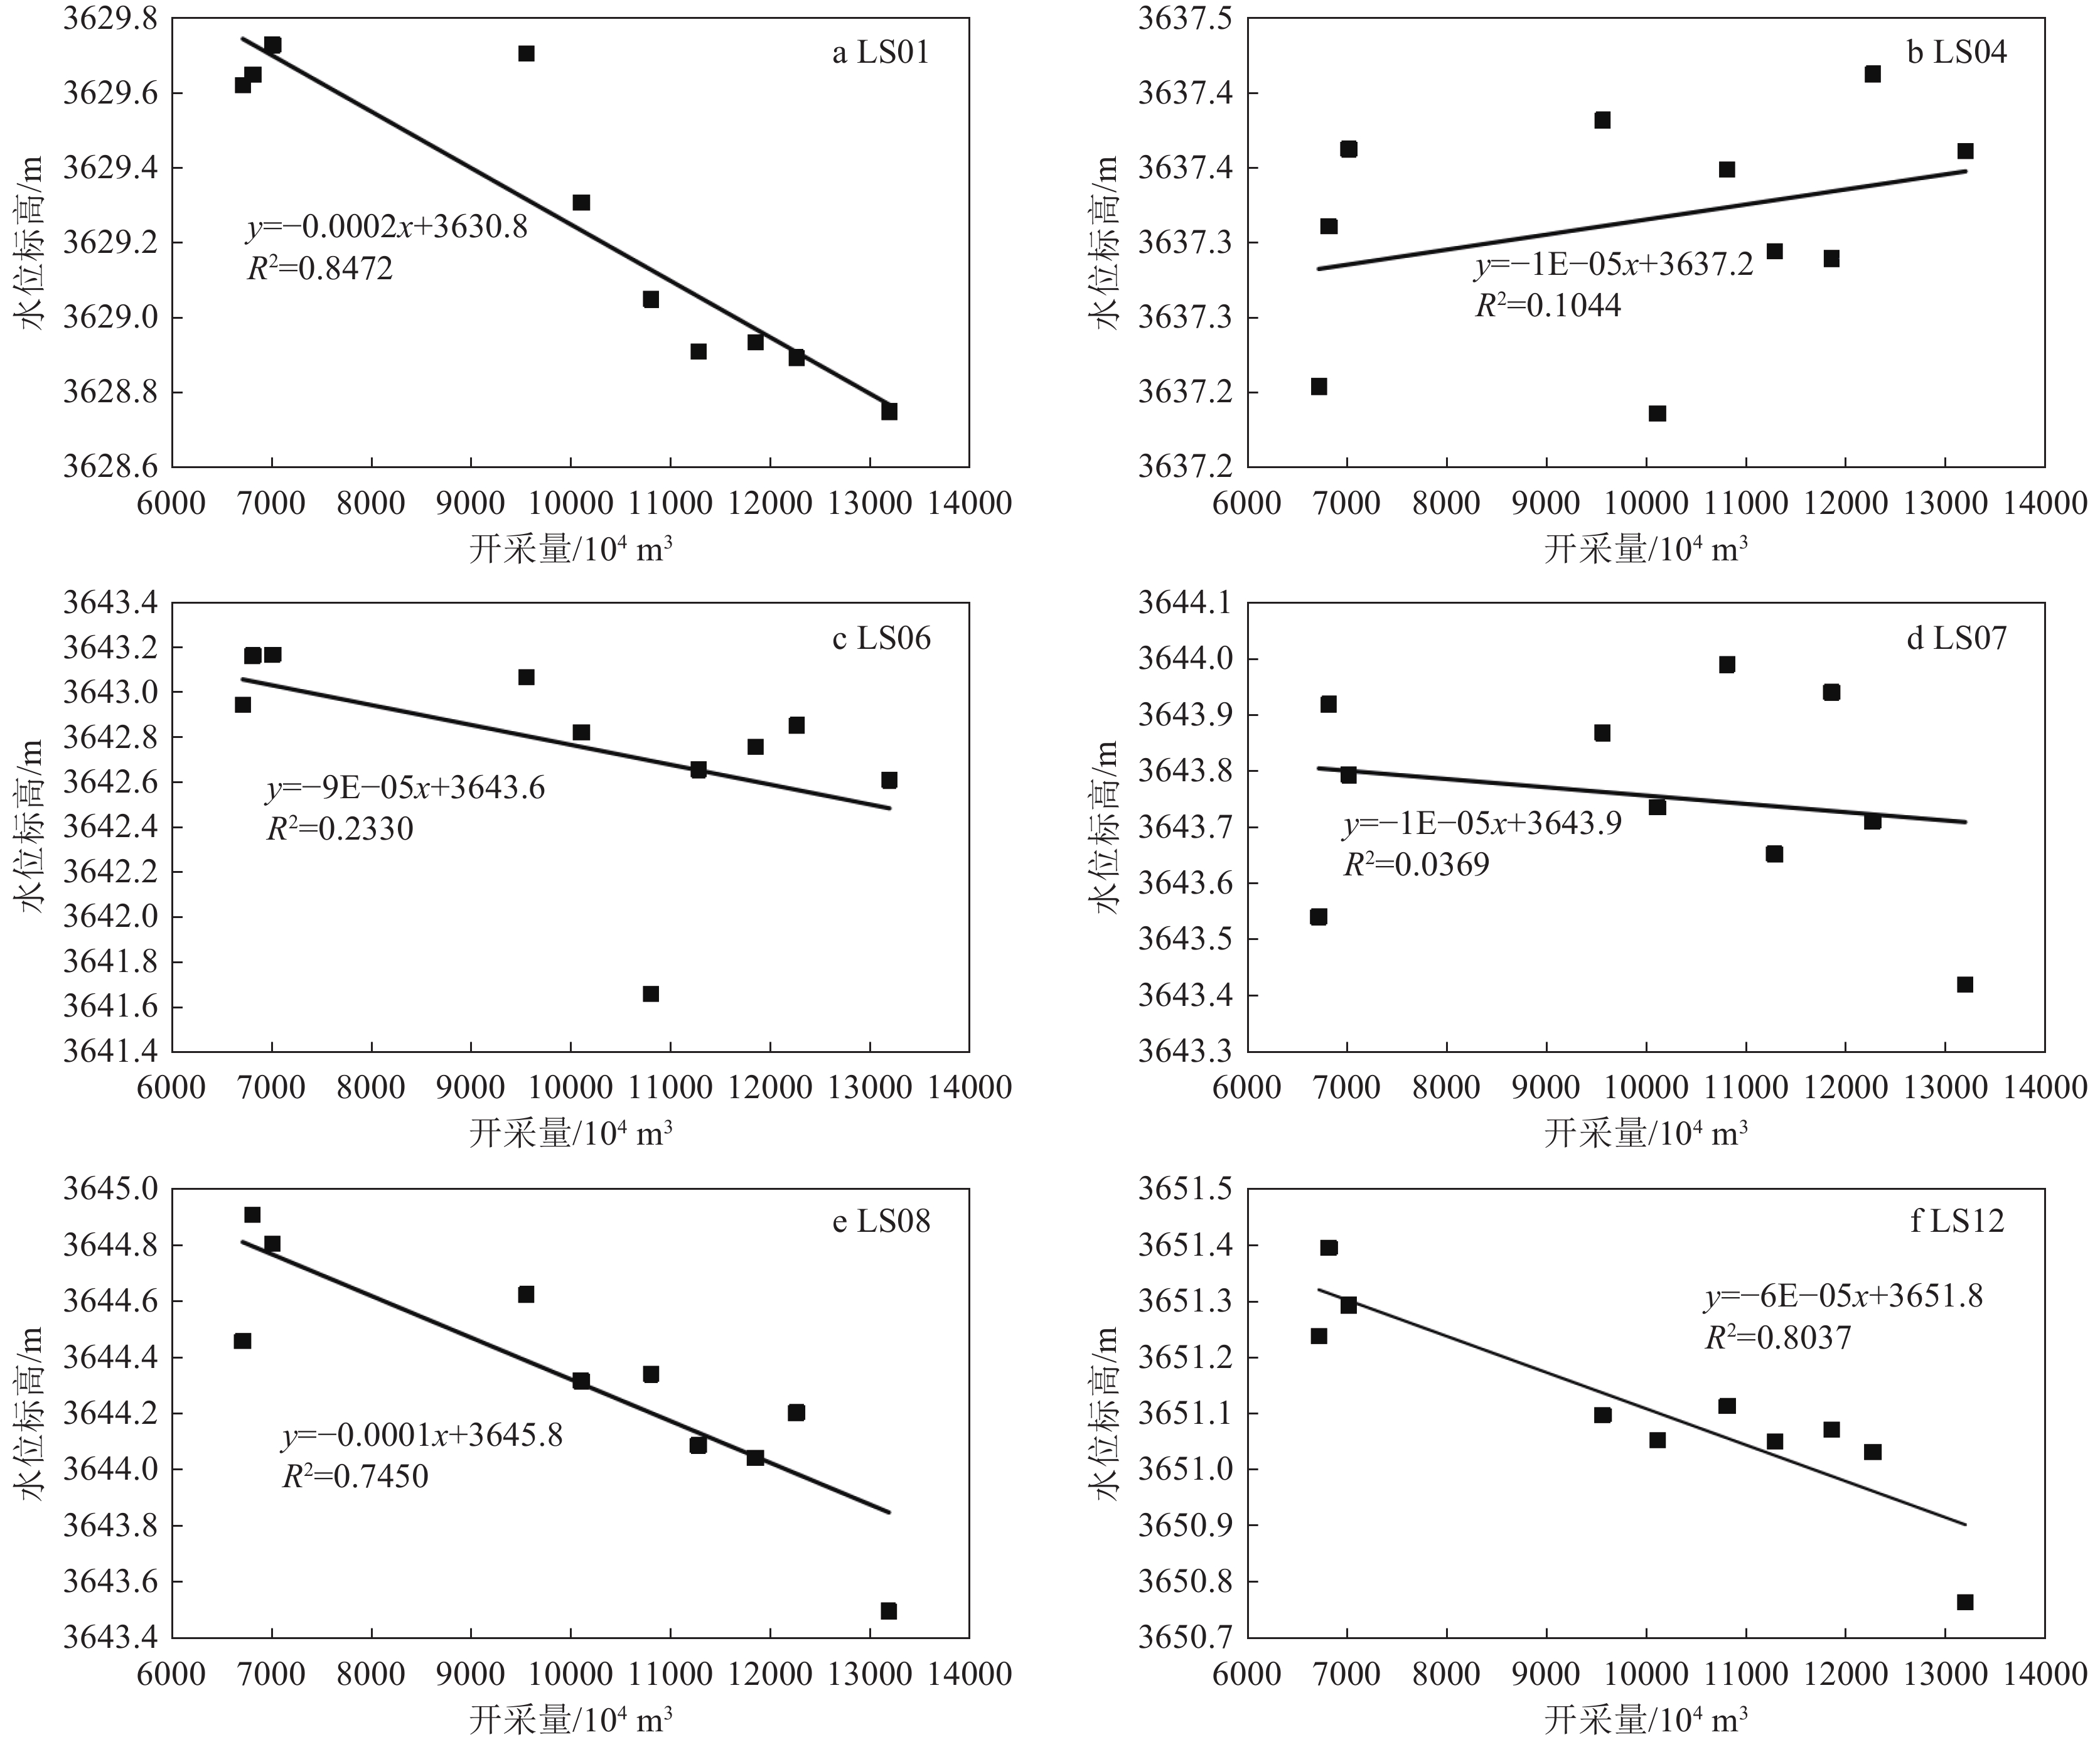
地貌分区 监测井号 相关系数 显著系数 山间沟谷冲洪积平原区 LS08 −0.863** 0.001 LS07 −0.192 0.595 拉萨河谷冲积平原区 LS012 −0.896** 0.001 LS06 −0.483 0.158 LS04 0.323 0.363 LS01 −0.920** 0.000 注:**为在 0.01 级别(双尾)相关性显著 表 8 1995—2015年城关区土地利用面积统计
Table 8 Land use statistics of Chengguan District from 1995 to 2015
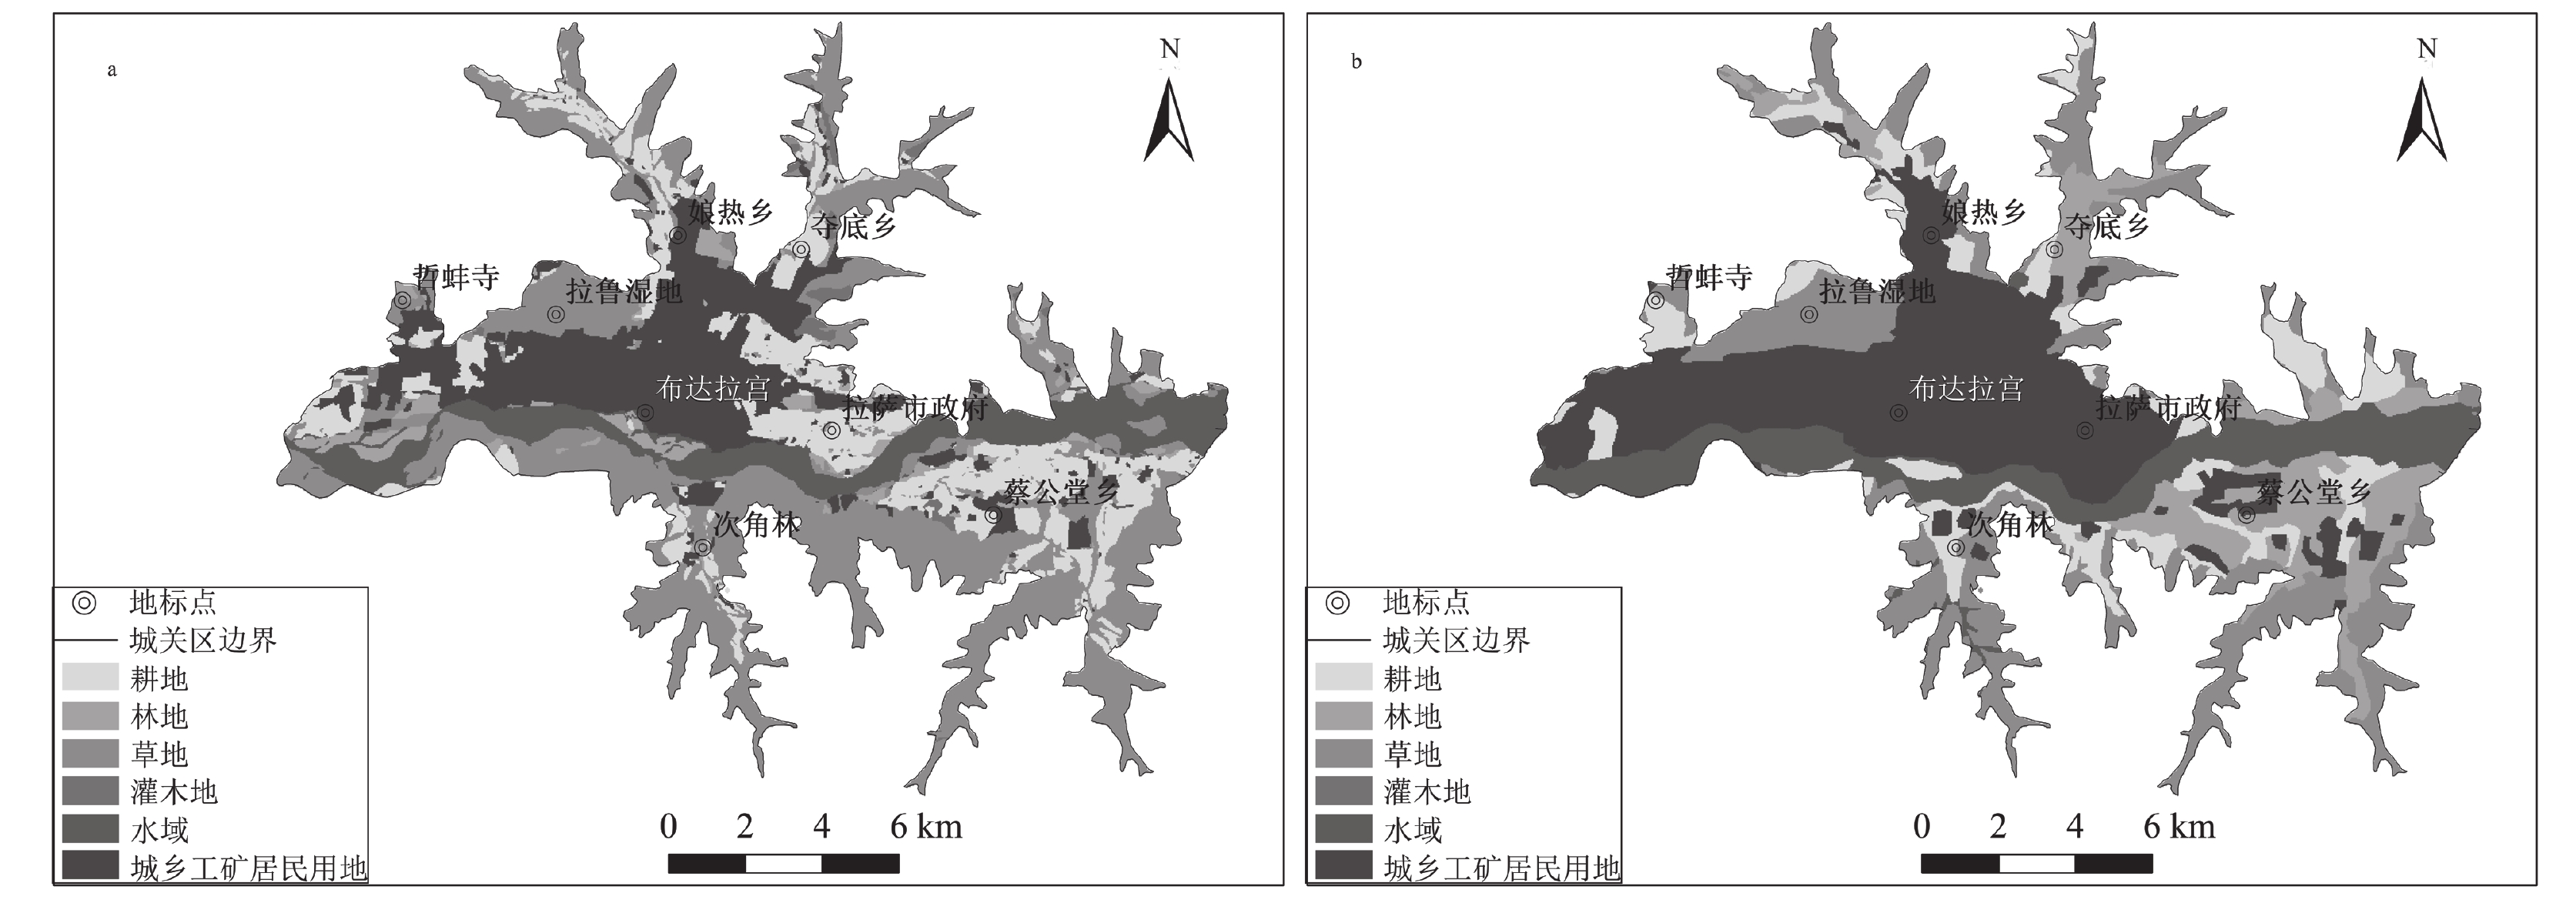
km2 年份 草地 城乡工矿居民建设用地 耕地 林地 水域 未利用土地 1995 67.37 34.12 31.28 6.50 18.95 2.00 2000 58.90 36.75 34.37 6.18 24.42 0.00 2005 58.12 40.17 31.70 6.20 24.42 0.00 2010 42.52 39.74 30.53 25.27 22.55 0.00 2015 42.42 55.19 19.80 20.06 22.78 0.00 表 9 城关区监测井地下水位与建设用地面积相关性分析结果
Table 9 Correlation analysis results between groundwater level of monitoring well and construction land area in Chengguan District
地貌分区 监测井号 相关系数 显著系数 山间沟谷冲洪积平原区 LS08 −0.986** 0.002 LS07 −0.954* 0.012 拉萨河谷冲积平原区 LS012 −0.969** 0.006 LS06 −0.982** 0.035 LS04 −0.970** 0.006 LS01 −0.955* 0.012 注:*为在 0.05 级别(双尾)相关性显著,**为在 0.01 级别(双尾)相关性显著 表 10 各影响因素与地下水位之间的关联度
Table 10 Degree of correlation between influencing factors and groundwater levels
监测井 降水量 气温 建设用地面积 开采量 LS01 0.743848 0.939396 0.722989 0.608418 LS04 0.743743 0.939547 0.723007 0.608402 LS06 0.743762 0.939525 0.723013 0.608415 LS07 0.743740 0.939561 0.723027 0.608421 LS08 0.744009 0.939146 0.722927 0.608409 LS12 0.743732 0.939573 0.72303 0.608421 多年平均 0.743765 0.939522 0.723016 0.608418 -
Chen J C, Kuang X X, Lancia M, et al. 2021. Analysis of the groundwater flow system in a high−altitude headwater region under rapid climate warming: Lhasa River Basin, Tibetan Plateau[J]. Journal of Hydrology: Regional Studies, 36(2021): 100871.
Fan J, Liu Q, Zhang Y, et al. 2005. Dynamic Variations and Influencing Factors of Groundwater Levels in Lhasa City[J]. Wuhan University Journal of Natural Science, 10(4): 665−665. Fan J, Liu Q, Zhang Y, et al. 2005. Dynamic Variations and Influencing Factors of Groundwater Levels in Lhasa City[J]. Wuhan University Journal of Natural Science, 10(4): 665−665.
Liu J, Gao Z, Wang M, et al. 2018. Study on the dynamic characteristics of groundwater in the valley plain of Lhasa City[J]. Environmental Earth Sciences, 77(18): 1−15.
安红梅, 邓利君, 赵矿, 等. 2018. 西藏地下水水化学特征及水质评价[J]. 水利规划与设计, (8): 45−47, 56. doi: 10.3969/j.issn.1672-2469.2018.08.014 翟思贝, 孙凤荣. 2021. 基于Mann-Kendall检验法的菏泽市降水变化规律分析[J]. 珠江水运, (13): 103−105. 高雅玉, 唐家凯, 钱鞠, 等. 2010. 土地利用/覆被变化对水环境影响的研究综述[J]. 人民黄河, 32(12): 16−18. doi: 10.3969/j.issn.1000-1379.2010.12.006 郭秀云. 2004. 灰色关联法在区域竞争力评价中的应用[J]. 统计与决策, 11: 55−56. doi: 10.3969/j.issn.1002-6487.2004.03.030 井江楠, 王文科, 段磊, 等. 2023. 保定平原地下水均衡要素变化解析[J]. 水文地质工程地质, 50(4): 115−126. 林聪业, 孙占学, 高柏, 等. 2021. 拉萨地区地下水水化学特征及形成机制研究[J]. 地学前缘, 28(5): 49−58. 刘婕, 杨鹏年, 阚建, 等. 2019. 变化环境下新疆沙湾县灌区地下水动态趋势及驱动因素[J]. 节水灌溉, (3): 53−58. doi: 10.3969/j.issn.1007-4929.2019.03.012 刘久潭. 2020. 拉萨市河谷平原区地下水循环演化及合理开采研究[D]. 山东科技大学博士学位论文. 尼玛吉, 杨勇, 次珍, 等. 2014. 1981—2010年拉萨市降水特征分析[J]. 中国农学通报, 30(17): 262−266. doi: 10.11924/j.issn.1000-6850.2013-2701 任建英. 2012. 一元线性回归分析及其应用[J]. 才智, (22): 116−117. 商佐, 唐蕴, 杨姗姗. 2020. 近30年吐鲁番盆地地下水动态特征及影响因素分析[J]. 中国水利水电科学研究院学报, 18(3): 192−203. 王国庆. 2006. 气候变化对黄河中游水文水资源影响的关键问题研究[D]. 河海大学博士学位论文. 王青, 戴思兰, 何晶, 等. 2012. 灰色关联法和层次分析法在盆栽多头小菊株系选择中的应用[J]. 中国农业科学, 45(17): 3653−3660. 王文圣, 丁晶. 2005. 水文小波分析[M]. 北京: 化学工业出版社. 王秀娟. 2016. 浅谈人类活动对拉萨城区地下水资源的影响[J]. 西藏科技, (2): 23−25. doi: 10.3969/j.issn.1004-3403.2016.02.008 吴建峰, 罗娜, 张凤太, 等. 2018. 基于Morlet小波分析的云贵高原区春季降水特征研究[J]. 中国农村水利水电, (5): 123−127,133. doi: 10.3969/j.issn.1007-2284.2018.05.025 徐羽, 许有鹏, 吴雷, 等. 2018. 太湖流域平原水网区浅层地下水动态特征及影响因素[J]. 湖泊科学, 30(2): 464−471. doi: 10.18307/2018.0218 杨媚. 2016. 西藏尼木近30年气候变化特征及主要气象灾害[J]. 西藏科技, (2): 63−65. doi: 10.3969/j.issn.1004-3403.2016.02.024 张孟丹, 余钟波, 谷黄河, 等. 2021. 无定河流域降水量空间插值方法比较研究[J]. 人民黄河, 43(4): 30−37,99. doi: 10.3969/j.issn.1000-1379.2021.04.006 普发贵. 2014. Mann-Kendall检验法在抚仙湖水质趋势分析中的应用[J]. 环境科学导刊, 33(6): 83−87. doi: 10.3969/j.issn.1673-9655.2014.06.021 张玉春, 于鹏生, 任剑翔. 2011. 甘肃省产业结构与经济增长的灰色关联分析[J]. 中国管理信息化, (16): 55−57. doi: 10.3969/j.issn.1673-0194.2011.16.033 周文武, 陈冠益, 穷达卓玛, 等. 2020. 拉萨市垃圾填埋场地下水水质的居民健康风险评价[J]. 环境化学, 39(6): 1513−1522. doi: 10.7524/j.issn.0254-6108.2019041101


 下载:
下载:

