
Study on land use change and carbon stock in northern Shanxi Province based on InVEST model
-
摘要:
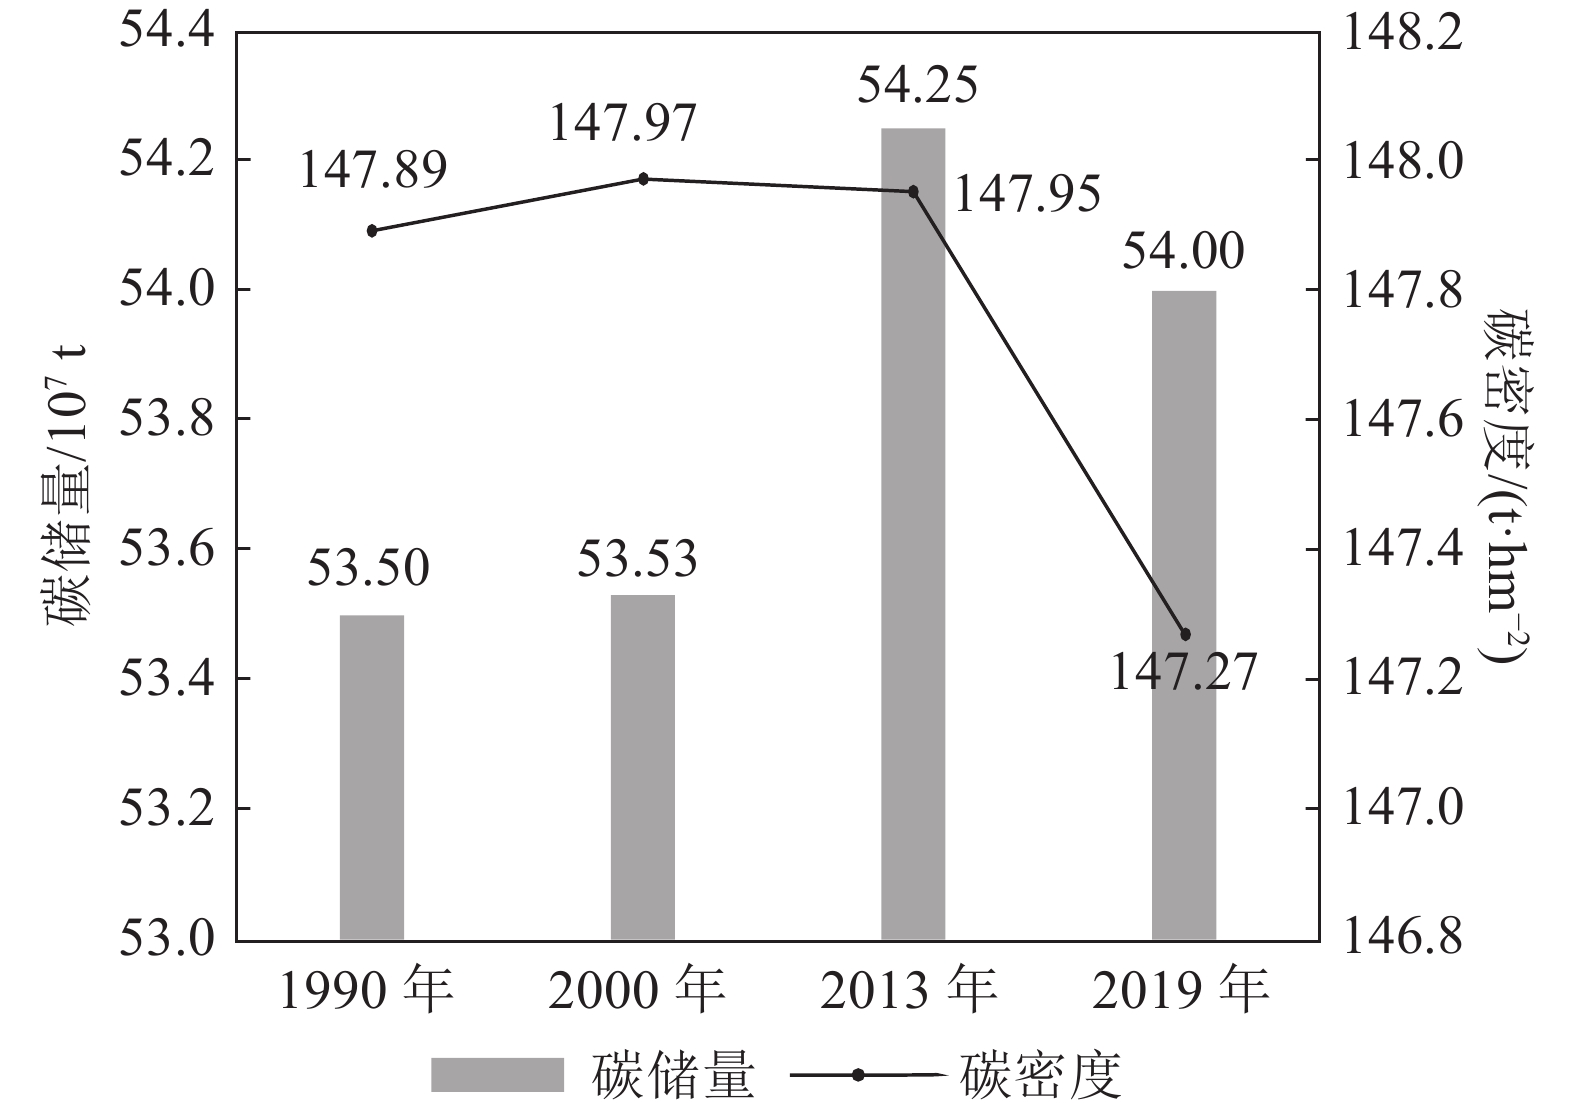
区域土地利用变化和碳储量的空间分布特征研究可为区域生态系统碳库管理和减排增汇政策制定提供重要科学依据。采用GIS和遥感技术分析了晋北地区1990年、2000年、2013年和2019年的土地利用变化特征,在此基础上,运用InVEST模型计算出晋北地区1990—2019年间生态系统碳储量和碳密度。结果表明,各土地利用类型之间的转换主要发生在2000—2013年间,转出面积最多的为耕地,转入面积最多的为建设用地和林地。这与该时段退耕还林政策的实施和粗放型经济快速增长有关。研究区1990年、2000年、2013年和2019年生态系统碳储量分别为53.50×10⁷ t、53.53×10⁷ t、54.25×10⁷ t和54.00×10⁷ t,碳平均密度分别为147.89 t/hm2、147.97 t/hm2、149.95 t/hm2和149.27 t/hm2。在总体碳储量中,土壤碳储量占比最大,超过80%,而林地对研究区生态系统碳储量的贡献值最大(约55%)。晋北地区应继续坚持退耕还林、水土保持等措施,以期能够用高效固碳来代偿建设用地扩张导致的碳损失。
Abstract:The study on the spatial distribution characteristics of regional land use change and carbon stock can provide an important scientific basis for the management of regional ecosystem carbon pools and the formulation of emission reduction and sink enhancement policies. Using GIS and remote sensing technology, this paper analyzes the change characteristics of spatial land use types in North Shanxi in 1990, 2000, 2013 and 2019, InVEST model was used to calculate the carbon storage and carbon density of the ecosystem in the study area. The results show that the conversion between land use types mainly occurred during 2000—2013, with the largest area transferred out being cropland and the largest area transferred in being construction land and forest land. Ecosystem carbon stocks in the study area during 1990, 2000, 2013 and 2019 were 53.50×10⁷ t, 53.53×10⁷ t, 54.25×10⁷ t and 54.00×10⁷ t, respectively, with an average carbon density of 147.89 t/hm2, 147.97 t/hm2, 149.95 t/hm2 and 149.27 t/hm2. Among the overall carbon stocks, soil carbon stocks accounted for the largest share, over 80%, while forest land contributed the largest value (about 55%) to the ecosystem carbon stocks in the study area. Measures such as returning farmland to forest and soil conservation should be continued in northern Shanxi Province, in order to be able to compensate for the carbon loss caused by the expansion of construction land with efficient carbon sequestration.
-
Keywords:
- carbon storage /
- carbon density /
- InVEST model /
- land use types /
- northern Shanxi Province
-
-
![]()
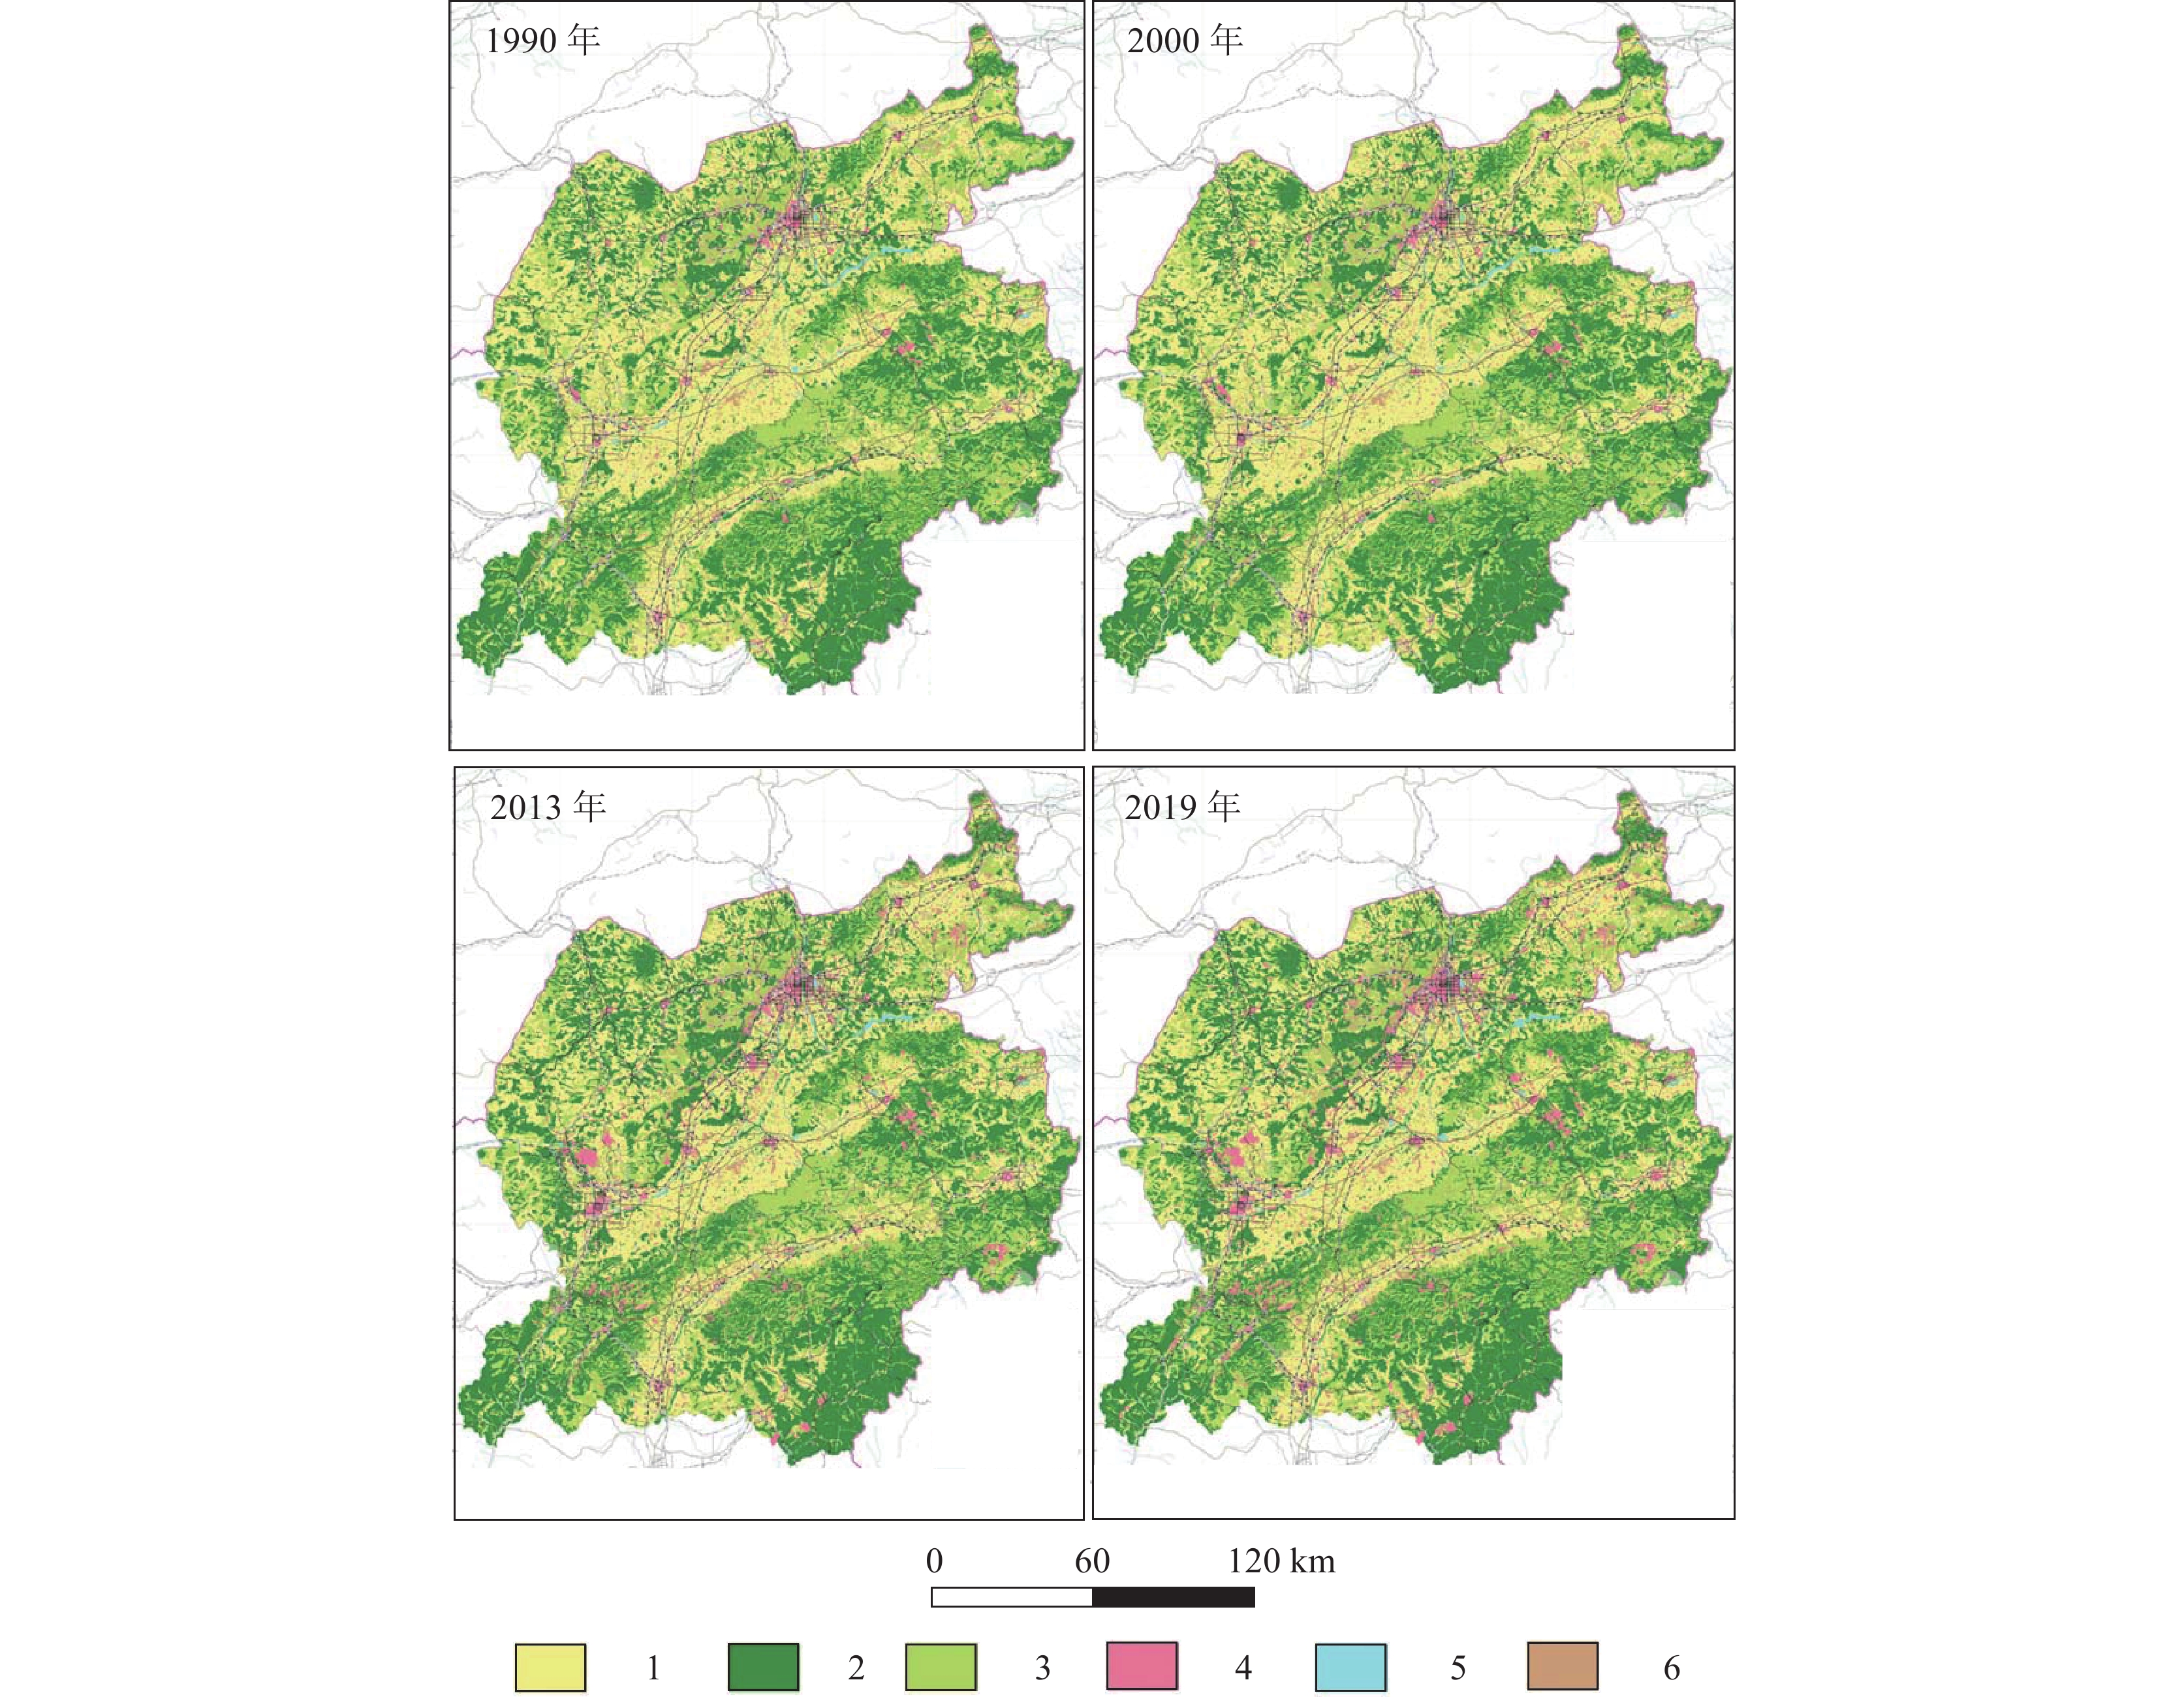
图 3 1990年、2000年、2013年和2019年晋北地区土地利用图
1—耕地;2—林地;3—草地;4—建设用地;5—水域;6—未利用地
Figure 3. Land use maps of northern Shanxi Province in 1990, 2000, 2013 and 2019
![]()
图 4 1990年、2000年、2013年和2019年晋北地区碳储量和碳密度变化
Figure 4. Changes of carbon storage and carbon density in 1990, 2000, 2013 and 2019 in northern Shanxi Province
表 1 晋北地区土地利用类型碳密度
Table 1 Carbon density of different land use types in northern Shanxi Province
t/hm2 类型 Ci-above Ci-below Ci-soil Ci-dead 耕地 4.02 0.80 105.14 0.40 林地 55.74 11.15 174.97 5.57 草地 0.39 0.08 96.89 0.03 水域 0.04 0.01 64.03 0 建设用地 0.01 0 57.63 0 未利用地 0.01 0 58.89 0  下载: 导出CSV
表 2 晋北地区1990年、2000年、2013年和2019年土地利用特征
Table 2 Land use patterns of northern Shanxi Province in 1990, 2000, 2013 and 2019
类型 1990年 2000年 2013年 2019年 面积 比例 面积 比例 面积 比例 面积 比例 耕地 127.15 35.15 128.25 35.45 110.21 30.47 109.08 30.15 林地 115.82 32.02 116.15 32.11 125.71 34.75 125.01 34.56 草地 99.50 27.50 97.17 26.86 93.48 25.84 92.06 25.44 水域 1.10 0.30 1.04 0.29 1.20 0.33 1.28 0.35 建设用地 16.95 4.69 17.91 4.95 29.64 8.19 32.71 9.04 未利用地 1.24 0.34 1.24 0.34 1.51 0.42 1.62 0.45 总计 361.76 100.00 361.76 100.00 361.76 100.00 361.76 100.00 注:面积单位为104 hm2,比例单位为%
下载: 导出CSV
表 3 晋北地区1990—2019年土地利用变化特征
Table 3 Change in land use patterns of northern Shanxi Province from 1990 to 2019
类型 1990—2000年 2000—2013年 2013-2019年 1990—2019年 面积 比例 面积 比例 面积 比例 面积 比例 耕地 1.10 0.87 −18.04 −14.07 −1.13 −1.03 −18.07 −14.21 林地 0.33 0.28 9.56 8.23 −0.70 −0.56 9.19 7.93 草地 −2.33 −2.34 −3.69 −3.80 −1.42 −1.52 −7.44 −7.48 水域 −0.06 −5.45 0.16 15.38 0.08 6.67 0.18 16.36 建设用地 0.96 5.66 11.73 65.49 3.07 10.36 15.76 92.98 未利用地 0.00 0.00 0.27 21.77 0.11 7.28 0.38 30.65 总计 361.76 100.00 361.76 100.00 361.76 100.00 0.00 0.00 注:面积单位为104 hm2,比例单位为%,正数表示增加,负数表示减少
下载: 导出CSV
表 4 晋北地区1990年、2000年、2013年和2019年生态系统四大基本碳库碳储量
Table 4 Four basic carbon pools in 1990, 2000, 2013 and 2019 in northern Shanxi Province
107t 年份 Cabove Cbelow Csoil Cdead 1990年 7.01 1.40 44.39 0.70 2000年 7.03 1.41 44.39 0.70 2013年 7.49 1.50 44.51 0.75 2019年 7.44 1.49 44.32 0.74
下载: 导出CSV
表 5 晋北地区1990年、2000年、2013年和2019年不同土地利用类型及生态系统碳储量
Table 5 Different land use types and ecosystem carbon storage of northern Shanxi Province in 1990, 2000, 2013, and 2019
类型 1990年 2000年 2013年 2019年 碳储量 比例 碳储量 比例 碳储量 比例 碳储量 比例 耕地 14.03 26.23 14.15 26.43 12.16 22.42 12.04 22.30 林地 28.66 53.57 28.74 53.69 31.10 57.34 30.93 57.28 草地 9.69 18.11 9.46 17.67 9.10 16.78 8.97 16.61 水域 0.07 0.13 0.07 0.13 0.08 0.15 0.08 0.15 建设用地 0.98 1.83 1.03 1.92 1.71 3.15 1.89 3.50 未利用地 0.07 0.14 0.07 0.13 0.09 0.17 0.10 0.19 总计 53.50 100.00 53.53 100.00 54.25 100.00 54.00 100.00 注:碳储量单位为107t,比例单位为%
下载: 导出CSV
-
Delaney M, Brown S, Lugo A E, et al. 1998. The Quantity and turnover of dead wood in permanent forest plots in six life zones of Venezuela[J]. Biotropica, 30(1): 2−11. doi: 10.1111/j.1744-7429.1998.tb00364.x
Han X H, Zhao F Z, tong X G, et al. 2017. Understanding soil carbon sequestration following the afforestation of former arable land by physical fractionation[J]. Catena, 150: 317−327. doi: 10.1016/j.catena.2016.11.027
IPCC. 2023. AR6 Synthesis Report: Climate Change 2023 [R]. Switzerland.
Jiang W G, Deng Y, Tang Z H, et al. 2017. Modelling the potential impacts of urban ecosystem changes on carbon storage under different scenarios by linkingthe CLUE-S andthe InVEST models[J]. Ecological Modelling, 345(2): 30−40.
Liang Y, Liu L, Huang J. 2017. Integrating the SD-CLUE-S and InVEST models into assessment of oasis carbon storage in northwestern China[J]. Plos One, 12(2): e0172494. doi: 10.1371/journal.pone.0172494
Nogueira E M, Yanai A M, Vasconcelos S S, et al. 2018. Carbon stocks and lossesto deforestation in protected areas in Brazilian Amazonia[J]. Regional Environmental Change, 18(5): 261−270.
Piyathilake I D U H, Udayakumara E P N, Ranaweera L V, et al. 2022. Modeling predictive assessment of carbon storage using InVEST model in Uva province, Sri Lanka[J]. Modeling Earth Systems and Environment, 8: 2013−2223.
Sharp R, Tallis H, Ricketts T, et al. 2018. InVEST 3.7. 0 user’s guide[M]. California: The Natural Capital Project, Stanford University, University of Minnesota, The Nature Conservancy, and World Wildlife Fund: 73−76.
Van der Werf G R, Morton D C, Defries R S, et al. 2009. Estimates of fire emissions from an active deforestation region inthe southern Amazon based on satellite data and biogeochemical modeling[J]. Biogeosciences, 6(2): 235−249. doi: 10.5194/bg-6-235-2009
Wang Z Y, Li X, Mao Y T, et al. 2021. Dynamic simulation of land use change and assessment of carbon storage based on climate change scenarios at the city level: A case study of Bortala, China[J]. Ecological Indicators, 134: 108499.
陈广生, 田汉勤. 2007. 土地利用/覆盖变化对陆地生态系统碳循环的影响[J]. 植物生态学报, 31(2): 189−204. 戴尔阜, 王晓莉, 朱建佳, 等. 2016. 生态系统服务权衡: 方法、模型与研究框架[J]. 地理研究, 35(6): 1005−1016. 郝晓敬, 张红, 徐小明, 等. 2020. 晋北地区土地利用覆被格局的演变与模拟[J]. 生态学报, 40(1): 257−265. 何涛, 孙玉军. 2016. 基于InVEST 模型的森林碳储量动态监测[J]. 浙江农林大学学报, 33(3): 377−383. 黄玫, 季劲钧, 曹明奎, 等. 2006. 中国区域植被地上与地下生物量模拟[J]. 生态学报, 26(12): 4156−4163. 孔君洽, 杜泽玉, 杨荣, 等. 2019. 黑河中游土地利用/覆被变化及其对碳储量影响的预测[J]. 中国沙漠, 39(3): 87−97. 李茂娟, 李天奇, 朱文博, 等. 2021. 基于InVEST模型的太行山区生态系统碳储量多维变化研究[J]. 河南大学学报(自然科学9版), 51(6): 631−642,684. 刘纪远. 1997. 国家资源环境遥感宏观调查与动态监测研究[J]. 遥感学报, 1(3): 225−230. 刘纪远, 匡文慧, 张增祥, 等. 2014. 20世纪80年代末以来中国土地利用变化的基本特征与空间格局[J]. 地理学报, 69(1): 13−14. 刘建华, 许皞, 王耀, 等. 2018. 基于土地利用格局变化的生态风险与固碳功能评价——以河北省黄骅市为例[J]. 中国生态农业学报, 26(8): 1217−1226. 朴世龙, 方精云, 贺金生, 等. 2004. 中国草地植被生物量及其空间分布格局[J]. 植物生态学报, 28(4): 491−498. 秦作栋, 王孟本, 薛占金. 2008. 晋北地区土地沙化现状及其成因分析[J]. 水土保持研究, 15(2): 168−172. 修珍珍, 王斌, 杨校生, 等. 2016. 基于INVEST 模型估算富阳市森林生态系统碳储量[J]. 广西植物, 36(7): 868−874. doi: 10.11931/guihaia.gxzw201405032 薛占金, 秦作栋, 孟宪文. 2011. 晋北地区环境特征及其土地沙化机制研究[J]. 水土保持研究, 18(2): 98−102. 张斯屿, 白晓永, 王世杰, 等. 2014. 基于InVEST模型的典型石漠化地区生态系统服务评估——以晴隆县为例[J]. 地球环境学报, 5(5): 328−338. 张徐, 李云霞, 吕春娟, 等. 2022. 基于InVEST 模型的生态系统服务功能应用研究进展[J]. 生态科学, 41(1): 237−242. 张燕, 师学义, 唐倩. 2021. 不同土地利用情景下汾河上游地区碳储量评估[J]. 生态学报, 41(1): 360−373. 张影, 谢余初, 齐姗姗, 等. 2016. 基于InVEST模型的甘肃白龙江流域生态系统碳储量及空间格局特征[J]. 资源科学, 38(8): 1585−1593. 朱建佳, 戴尔阜, 郑度, 等. 2018. 采伐影响下人工林木材生产与固碳功能权衡特征: 以湖南会同森林生态实验站为例[J]. 地理学报, 73(1): 152−163. 朱文博, 张静静, 崔耀平, 等. 2019. 基于土地利用变化情景的生态系统碳储量评估——以太行山淇河流域为例[J]. 地理学报, 74(3): 446−459. 邹文涛, 何友均, 叶兵, 等. 2020. 基于InVEST 模型的森林生态系统服务功能评估研究进展[J]. 世界林业研究, 33(4): 19−24.
计量
- 文章访问数: 934
- HTML全文浏览量: 363
- PDF下载量: 265
